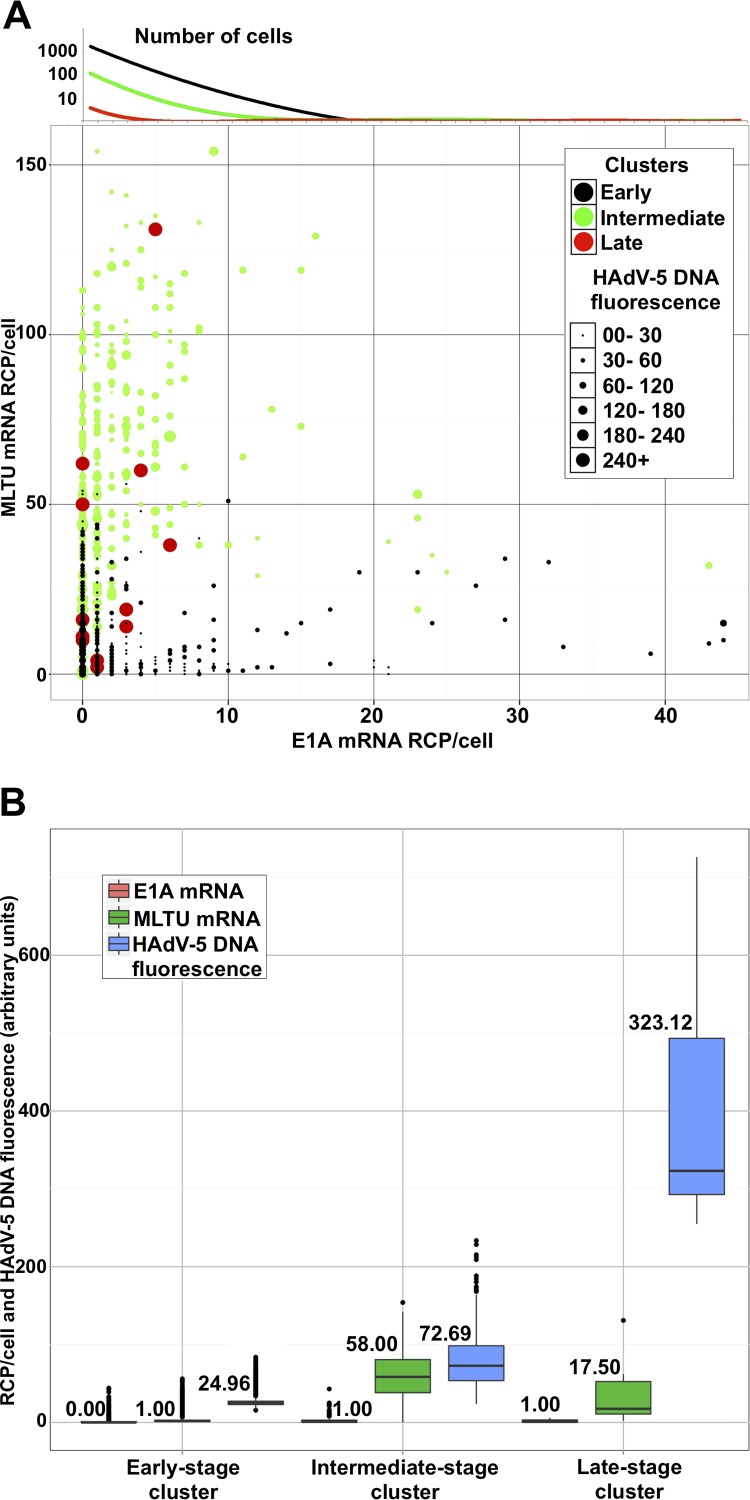
FIG 7.
Quantification of HAdV-5 DNA and viral mRNAs in BJAB cells at 6 dpi. (A) Each data point (which represents an individual cell) was distributed in the scatterplot depending on E1A (13S and 12S; x axis) and MLTU expression (exon I_II and exon II_III; y axis). The diameter of the data point is proportional to HAdV-5 DNA content based on its fluorescence signal. Cells were grouped into 3 infection stage clusters (early [black], intermediate [green], and late [red]) using k-means clustering, based on HAdV-5 DNA abundance and viral mRNA expression. Since a two-dimensional scatterplot does not reflect cell abundance, the E1A mRNA expression trend line for all clusters is plotted above its corresponding axis against the log10 cell number. The dominant population of cells expressing low E1A mRNA levels is clearly indicated (black line). (B) BJAB cells were divided into clusters (x axis). The lower and upper hinges of box plots correspond to the first and third quartiles (the 25th and 75th percentiles). Black line, median (also the number above/below a box plot); upper whisker, highest value that is within 1.5× the interquartile range of the hinge; lower whisker, lowest value within 1.5× the interquartile range of the hinge.

