
Fig. 6.
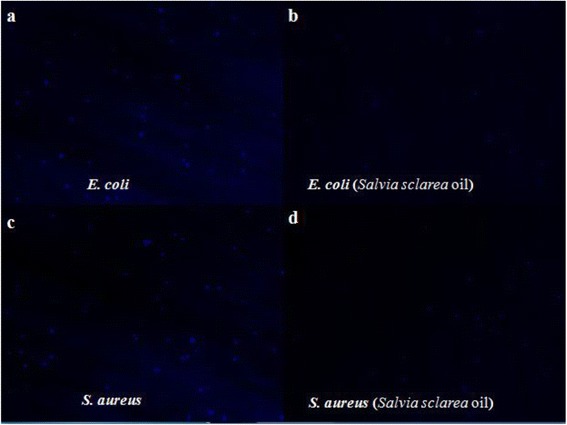
DNA fluorescence images of E. coli and S. aureus cells before (a, c) and after (b, d) Salvia sclarea oil treatment
Official websites use .gov
A
.gov website belongs to an official
government organization in the United States.
Secure .gov websites use HTTPS
A lock (
) or https:// means you've safely
connected to the .gov website. Share sensitive
information only on official, secure websites.
DNA fluorescence images of E. coli and S. aureus cells before (a, c) and after (b, d) Salvia sclarea oil treatment