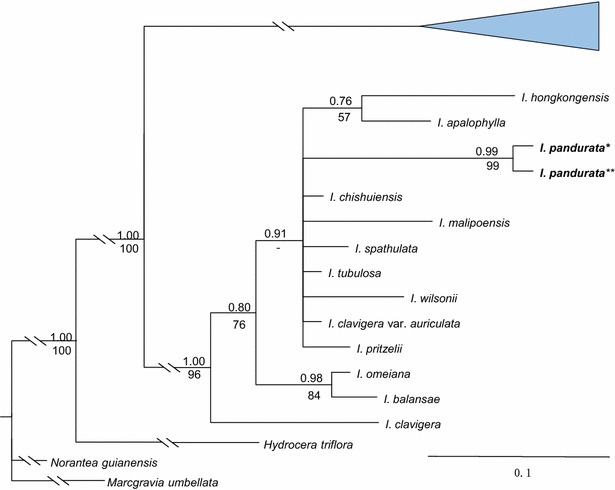
Fig. 4.

Partial Bayesian consensus phylogram based on the branch lengths of the cpDNA data (atpB-rbcL + trn L-F). Numbers above and below branches are Bayesian posterior probabilities (>0.5) and bootstrap percentages (>50 %), respectively. “−” indicates nodes not supported
