
Fig. 2.
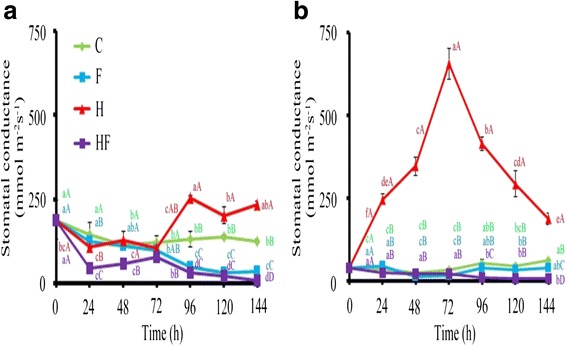
Stomatal conductance in stressed plants. Stomatal conductance in TSS-AVRDC-2 (a) and B-75 (b) plants under control (C), waterlogging (F), 40 °C (H), and waterlogging at 40 °C (HF) treatments for 0, 24, 72, 48, 96, 120, and 144 h. Values represent the means of five independent plants. Values represent the means of five independent plants. Means with the same small letters are not significantly different among times within the same row, based on LSD at p ≤ 0.05 under ANOVA. Means with the same capital letters are not significantly different between treatments within the same time point, based on LSD at p ≤ 0.05 under ANOVA