Fig. 4.

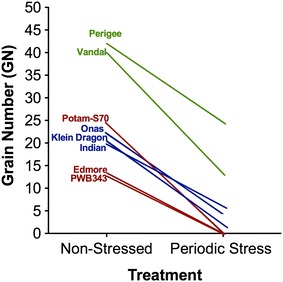
The graph shows the genetic variance in response to the periodic stress. The periodic drought stress has a negative impact on the grain number, and was varied across the different genotyes

The graph shows the genetic variance in response to the periodic stress. The periodic drought stress has a negative impact on the grain number, and was varied across the different genotyes