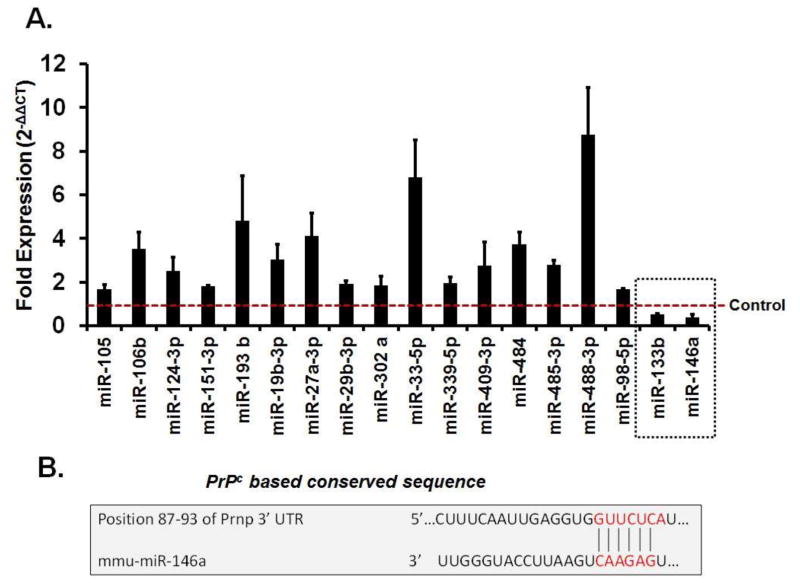
Figure 3. MiRNAs regulation in diabetic brains.
(A) Bar graph showing altered miRNAs in T2D db/db brains using qRT2-PCR analysis. Control is represented by red dashed line. Two miRNAs (miR-133b and miR-146a), indicated in dashed square box, were downregulated as compared to control. (B) Figure showing sequence homology of miR-146a with conserved sequence of PrPc (prion) protein.

