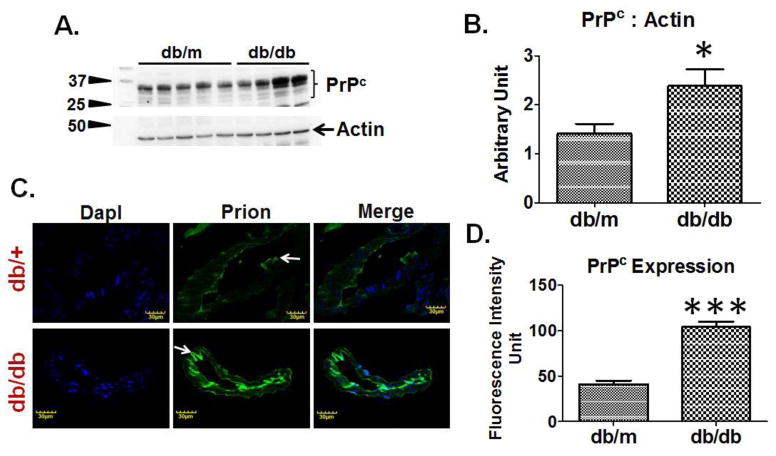
Figure 4. PrPc regulation in T2D db/db mice.
(A) Western blot images showing PrPc expression and, (B) bar graph showing normalized PrPc band density with actin in T2D db/db and db/m control brains (n=6). (C) Immunohistochemistry images and, (D) bar graph showing fluorescence intensity of PrPc protein in T2D db/db and db/m control brain vessels (n=3). *p <0.05, ***p <0.001–vs. db/m control.

