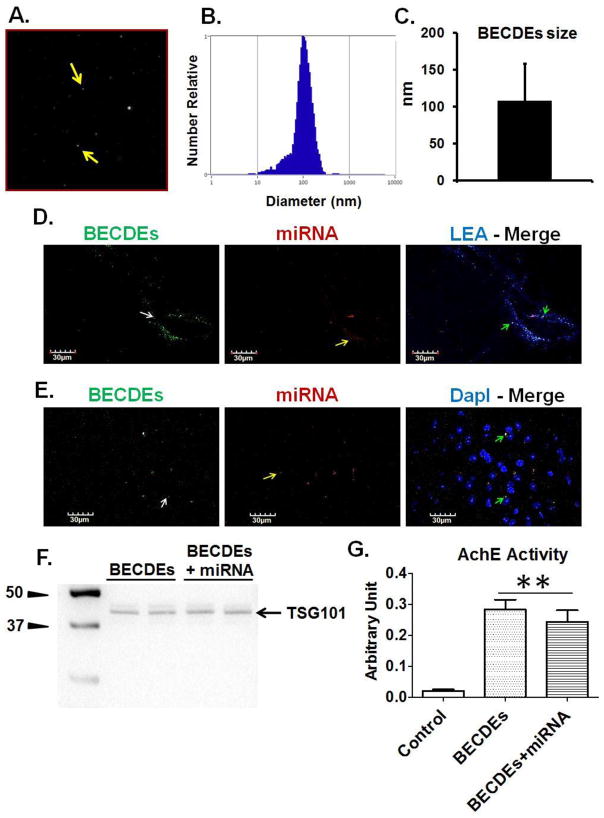
Figure 5. Characterization of BECDEs and intracerebroventricular delivery of BECDEs loaded with miRNAs.
(A) Nano-tracking analysis (NTA) image showing BECDEs (yellow arrow). (B) NTA derived peak, confirming the size distribution of BECDEs nano-vesicles. (C) Bar diagram showing BECDEs size that appeared to be 108.4± 49.8 (mean ± SD). (D) Immunohistochemistry images showing presence of BECDEs (left lane, green color, white arrow) and miRNA (middle lane, red color, yellow arrow) around brain pial vessel and (E), cortical area. The brain vessel was infused with lycopersicon esculentum agglutinin (top right lane, blue color) and nuclei were stained with DapI (bottom right lane, blue color). (F) Western blot image showing TSG101 band and, (G) bar graph showing acetylcholinesterase activity in miR-146a loaded and non-loaded BECDEs along with control. Control is supernatant deprived of BECDEs (n=3). **p <0.001–vs. control

