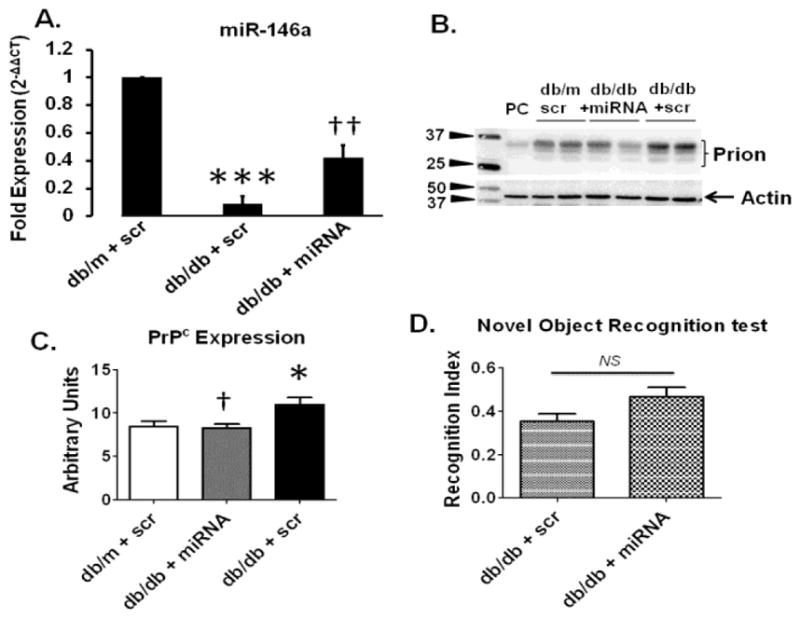
Figure 6. Effect of miR-146a mimic, loaded with BECDEs, on PrPc expression and memory function in T2D db/db mice.

(A) QPCR analysis showing transcript level of miR-146a in T2D db/db mice administered with scramble (scr) miRNA-, and miR146a-loaded BECDEs (n=3). (B) Western blot images and, (C) analyzed band density of PrPc with actin in db/m and T2D db/db mice administered with scramble-loaded BECDEs, and T2D db/db mice miR146a-loaded BECDEs, PC, positive control, mouse heart tissue. Bar graph showing recognition index in T2D db/db mice administered with scramble-, and miR146a-loaded BECDEs (n=4). *p <0.05, ***p <0.001–vs. db/m + scramble, † p <0.05, †† p <0.01–vs. T2D db/db + scramble.
