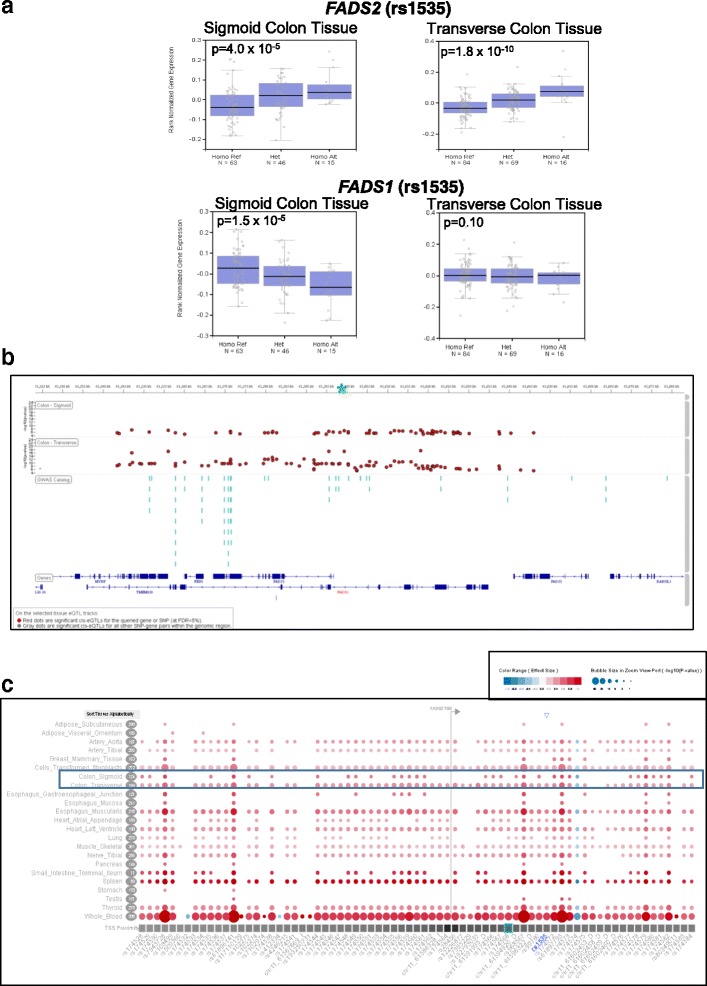
Fig. 1.

eQTL for rs1535 in Normal Sigmoid and Transverse Colon Tissue. a Box plots of gene expression profiles for FADS2 and FADS1 expression by genotype in normal sigmoid and transverse colon tissue. Reference Allele (risk allele) = A; Alternate Allele = G. b cis-eQTLs (+/− 1 Mb window) for FADS2 in normal sigmoid and transverse colon tissue. rs1535 is indicated by the green asterisk (*). c cis-eQTLs for FADS2 in 23 different tissue types. Bubble size represents –log10(p-value) and color and shading of the bubble represents effect size of the cis-eQTL
