
Fig. 5.
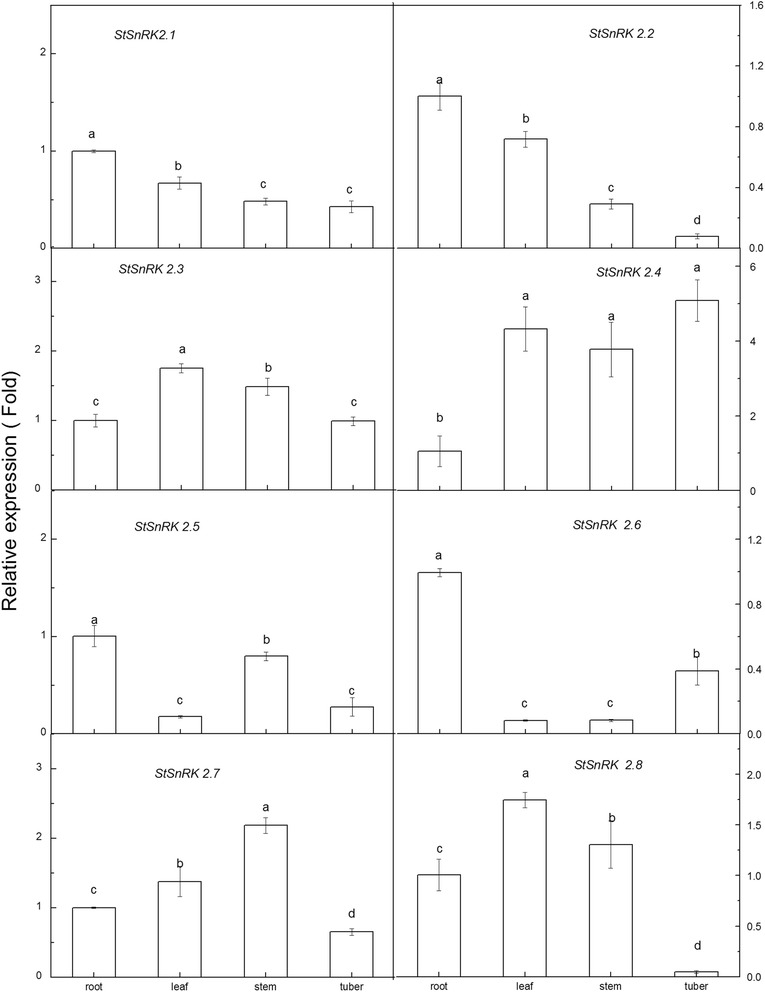
Results are presented as differential relative transcript abundance of StSnRK2.1 to StSnRK2.8 in different tissues; data represent the means ± SD of three replicates and different letters indicate significant difference at P < 0.05. Total RNA was extracted from 60-day-old plants. Y-axis showed the transcript fold to that in roots