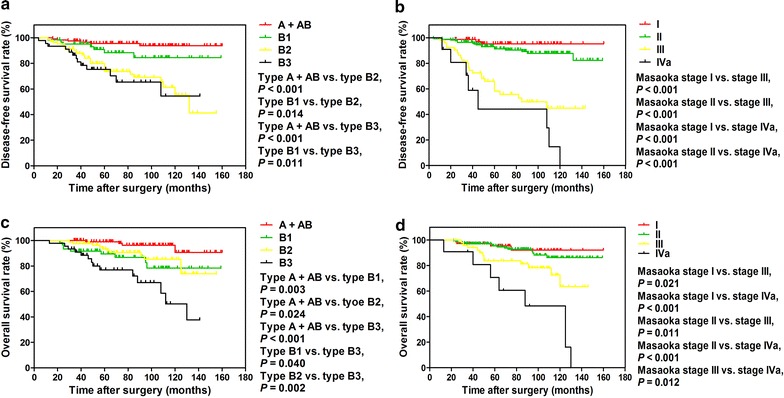
Fig. 1.

Kaplan–Meier analysis of survival curves for patients with thymoma after initial resection. a Disease-free survival curves stratified according to the WHO histological classification. b Disease-free survival curves stratified according to the Masaoka stage. c Overall survival curves stratified according to the WHO histological classification. d Overall survival curves stratified according to the Masaoka stage
