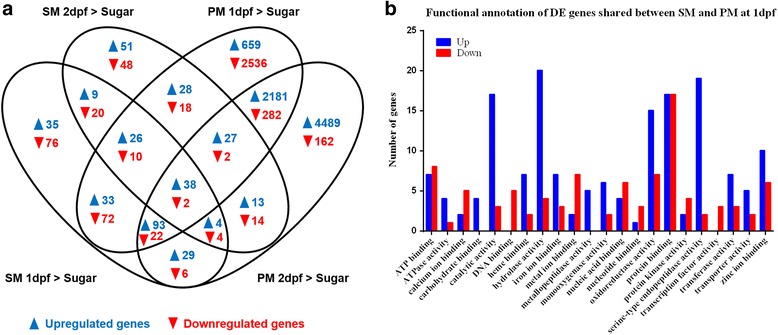
Fig. 5.

Differential expressed (DE) genes induced by SM and PM at 1 and 2 days post-feeding (dpf) and functional annotation of DE genes at 1 dpf. a Venn diagram representing shared DE genes between sugarfed controls and SM/PM samples at 1 and 2 dpf. b Histogram presentation of functional categories (as annotated in Vectorbase) of upregulated (Up) and downregulated (Down) DE genes shared between SM and PM samples at 1 dpf. Gene ontology was analyzed using BioMart at Vectorbase. The x-axis denotes the number of genes in a functional category
