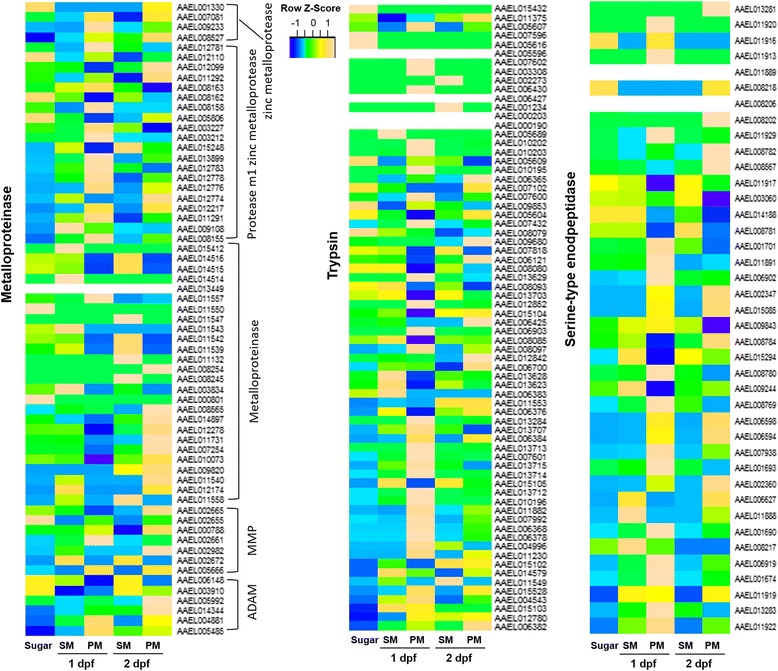
Fig. 6.

Median-normalized expression levels (at FPKM) of three groups of proteinase genes (metalloproteinases, trypsins, and serine-type endopeptidases). Data show a comparison between sugarfed controls and SM/PM samples at 1 and 2 days post-feeding (dpf) and are presented as heatmaps for each transcript (vertical axis) at each time point (horizontal axis), with yellow and blue indicating high and low levels of expression, respectively
