Fig. 2.

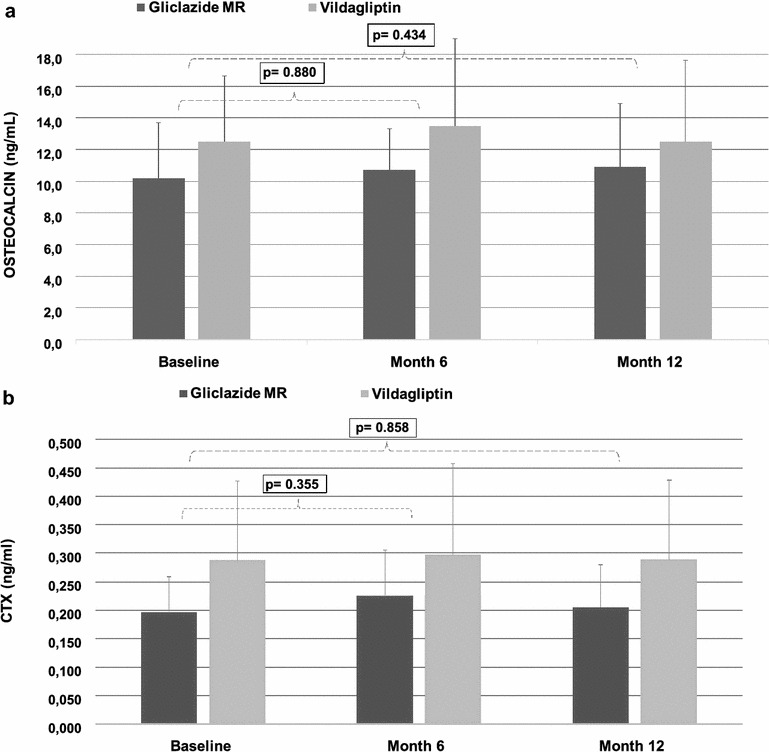
Progression of osteocalcin (a) and CTX (b) serum levels during the 12-month period (p values calculated for differences between means in months 6 and 12 versus baseline)

Progression of osteocalcin (a) and CTX (b) serum levels during the 12-month period (p values calculated for differences between means in months 6 and 12 versus baseline)