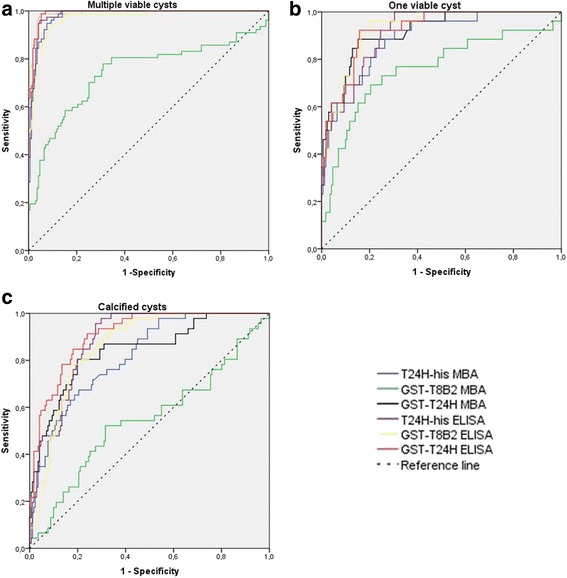
Fig. 3.

ROC curves of the different antigens tested in ELISA and MBA with serum samples from neurocysticercosis patients with two or more viable cysts (a), only one viable cyst (b) and only calcified (non-viable) cysts (c)

ROC curves of the different antigens tested in ELISA and MBA with serum samples from neurocysticercosis patients with two or more viable cysts (a), only one viable cyst (b) and only calcified (non-viable) cysts (c)