. 2014 Oct 1;6(1):203–208. doi: 10.1039/c4sc02789b

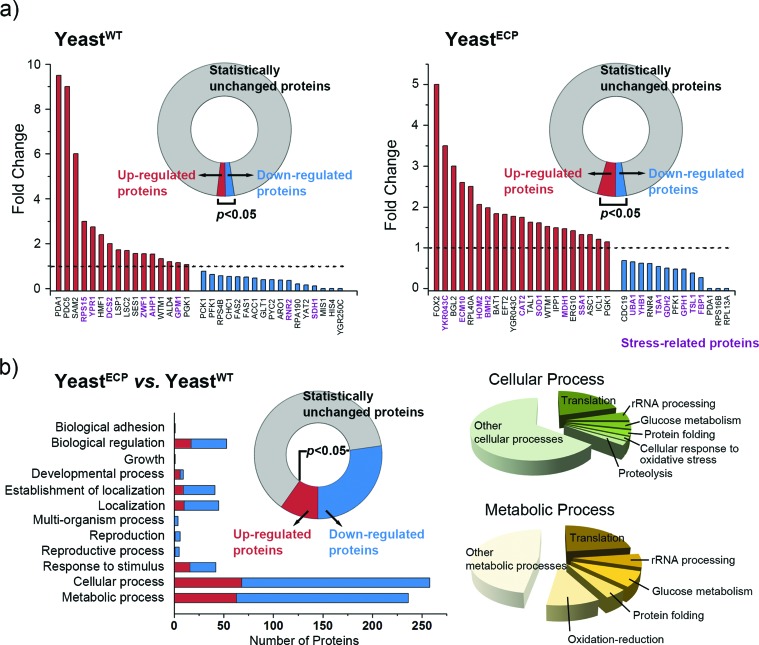
Fig. 3. Mass spectrometry-based proteomic analysis of yeastWT and yeastECP. (a) Proteome-wide analysis of yeastWT and yeastECP after UV-C irradiation. The expression change was evaluated based on the fold change (Fc) value. The Fc value = spectral count of yeastECP/spectral count of yeastWT; up-regulated with 1 < Fc and down-regulated with 1 > Fc. The known stress-related proteins are denoted in purple. (b) Proteome-wide analysis of yeastECP vs. yeastWT before UV-C irradiation. Left bar graph: the number of changed proteins in each category of biological process. Right pie charts: sub-categorization of the cellular process or metabolic process.

Fig. 3