Fig. 6.

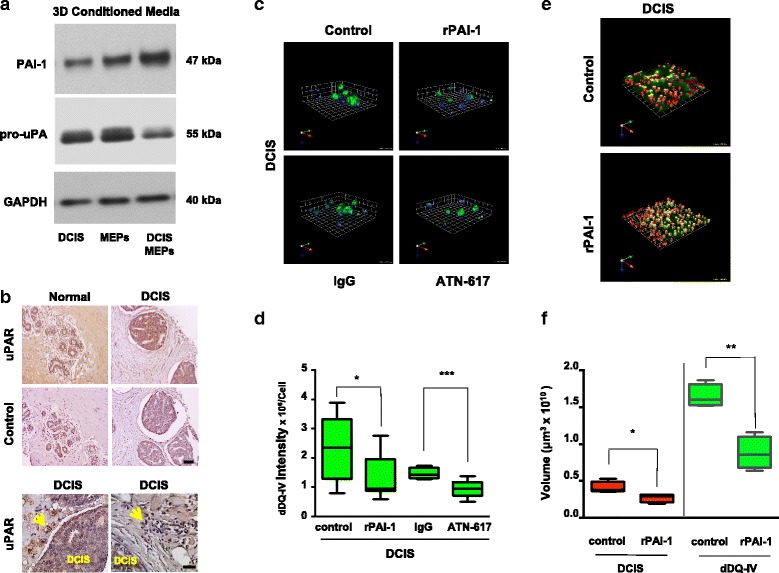
Analysis and targeting of the plasminogen activation pathway results in decreased extracellular matrix (ECM) degradation by ductal carcinoma in situ (DCIS) structures formed in mammary architecture and microenvironment engineering (MAME) cultures. a Media conditioned from 8-day 3D cultures of myoepithelial cells (MEPs) alone, DCIS cells alone, and DCIS-MEP cocultures were analyzed by immunoblotting for plasminogen activator inhibitor 1 (PAI-1) and pro-urokinase plasminogen activator (pro-uPA). Immunoblotting for glyceraldehyde 3-phosphate dehydrogenase (GAPDH) in cell lysates was used as a loading control. b Representative images from a tissue microarray containing adjacent normal and DCIS specimens were stained for human urokinase plasminogen activator receptor (uPAR) with ATN-617 antibody (5 μg/ml) (top rows) and preimmune immunoglobulin G (IgG) (control). Scale bar = 100 μm (middle rows). In DCIS specimens imaged at a higher magnification, stromal cells (arrows) can be seen to exhibit strong staining for uPAR. Scale bar = 50 μm (bottom rows). All sections were counterstained with hematoxylin. c MCF10.DCIS (DCIS) cells were seeded in reconstituted basement membrane (rBM) overlay cultures containing dye-quenched collagen IV (DQ-collagen IV) in the absence (control) or presence of 250 nM human recombinant plasminogen activator inhibitor 1 (rPAI-1), preimmune IgG (IgG), or 10 μg/ml uPAR blocking antibody (ATN-617) and imaged live at day 4. Representative angled views of 3D reconstructions of DCIS structures illustrate nuclei (blue) and DQ-collagen IV degradation products (dDQ-IV, green). One grid unit = 45 μm. d Intensity of dDQ-IV per cell was quantified from a minimum of three independent experiments using Volocity software (n = 8–14). * p ≤ 0.05 and *** p ≤ 0.0005 as determined by unpaired t test, two-sided. MCF10.DCIS-lenti-RFP cells (DCIS, red) were seeded into rBM overlay cultures containing DQ-collagen IV in the absence (control) or presence of rPAI-1 and imaged live at day 4. e Representative angled views of 3D reconstructions of DCIS (red) structures and associated dDQ-IV (green). One grid unit = 180 μm. f Volumes of DCIS structures (red) and dDQ-IV (green) in the absence (control) and presence of rPAI-1 were quantified from a minimum of three independent experiments using Volocity software (n = 4). * p ≤ 0.05 and ** p ≤ 0.005 as determined by unpaired t test, two-sided. Data are presented as box-and-whisker plots where the box represents the interquartile range and whiskers represent minimum and maximum values. Images are representative of at least three independent experiments. Additional results are shown in Additional file 11: Table S1, Additional file 12: Table S2, and Additional file 13: Table S3
