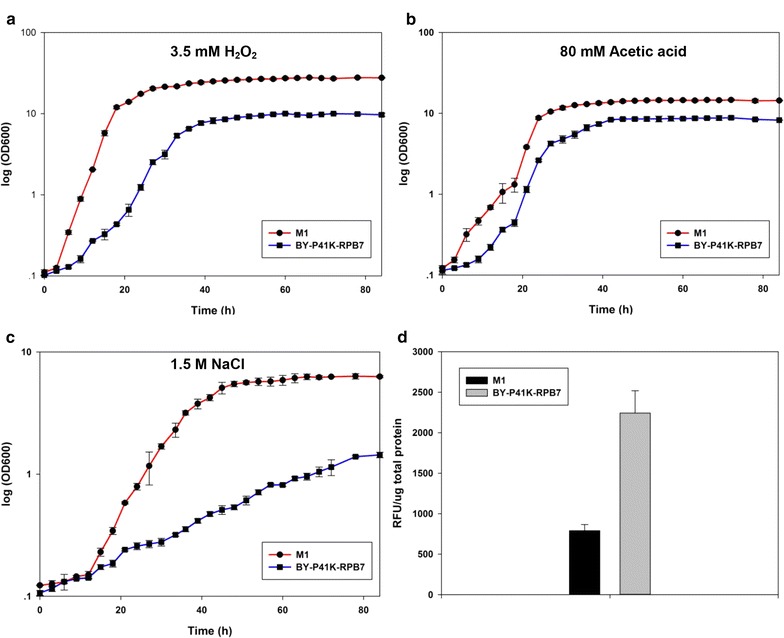
Fig. 3.

Cross-tolerance towards different inhibitors. M1 in a 3.5 mM H2O2; b 80 mM acetic acid; c 1.5 M NaCl. d Intracellular ROS level in M1 when cells reached early log phase (OD600 = 1). ROS level is positively correlated to the fluorescence intensity of probe H2DCFDA. All experiments were performed in triplicates
