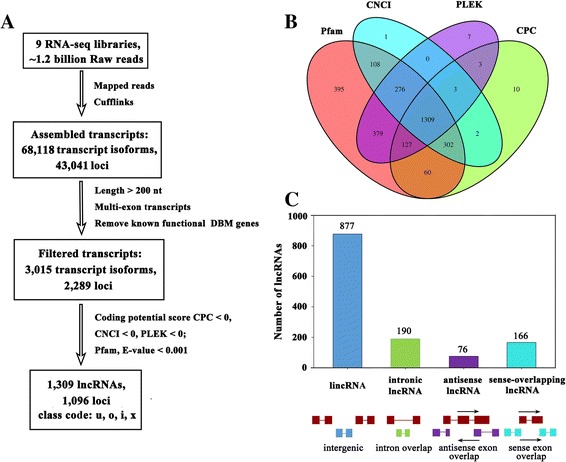
Fig. 1.

The computational pipeline for identifying lncRNAs in P. xylostella from RNA-seq data and their classification. a The lncRNA identification pipeline flowchart; b Coding potential analysis using the four methods; c The classification of identified lncRNAs, red rectangles or lines represent the exon or intron of protein-coding gene, respectively; Blue, green, purple and light blue rectangles or lines represent the exon or intron of lncRNA, respectively
