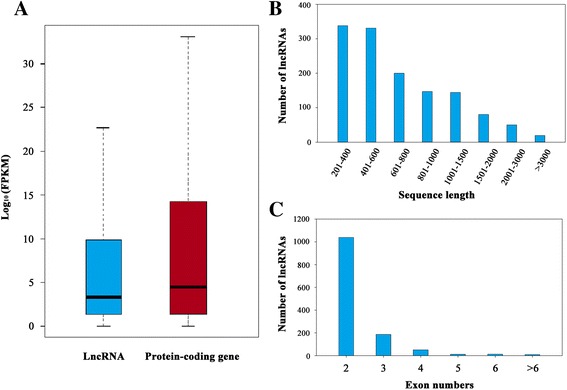
Fig. 2.

Characterization of P. xylostella lncRNAs. a Comparison of expression value (FPKM) in P. xylostella lncRNAs and protein coding genes; For the box-plot: midline, median; box limits, 25th percentile (first quartile) and 75th percentile (third quartile); upper whisker, min (max(x)), third quartile + 1.5× interquartile range (IQR; third-quartile minus first-quartile values); lower whisker, max(min(x)), first quartile − 1.5× IQR; b Size distribution of P. xylostella lncRNAs; c The distribution of exon number of lncRNAs
