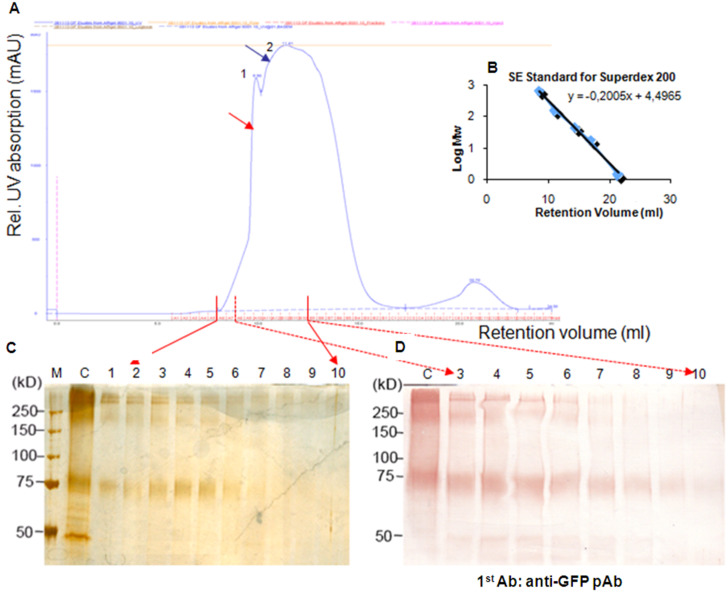
Figure 4.
Purification of the GAT1/GFP fusion protein from Sf9 cells by SE-FPLC. (A) Elution profile of GAT1/GFP after SE-FPLC on a Superdex 200TM column. (B) The standard linear regression curve of the Superdex 200TM column was generated by plotting the log of the molecular masses of different calibration proteins against their elution volumes. (C), (D) Silver staining and Western blotting of the SDS-PAGE (7.5%) results of eluted fractions (from 8.8 to 11.8 mL) after SE-FPLC. M: standard marker; C: concentrated sample from immunoaffinity column; 1–10: SE-FPLC fractions from 8.8 to 10.8 mL.

