Fig. 3.

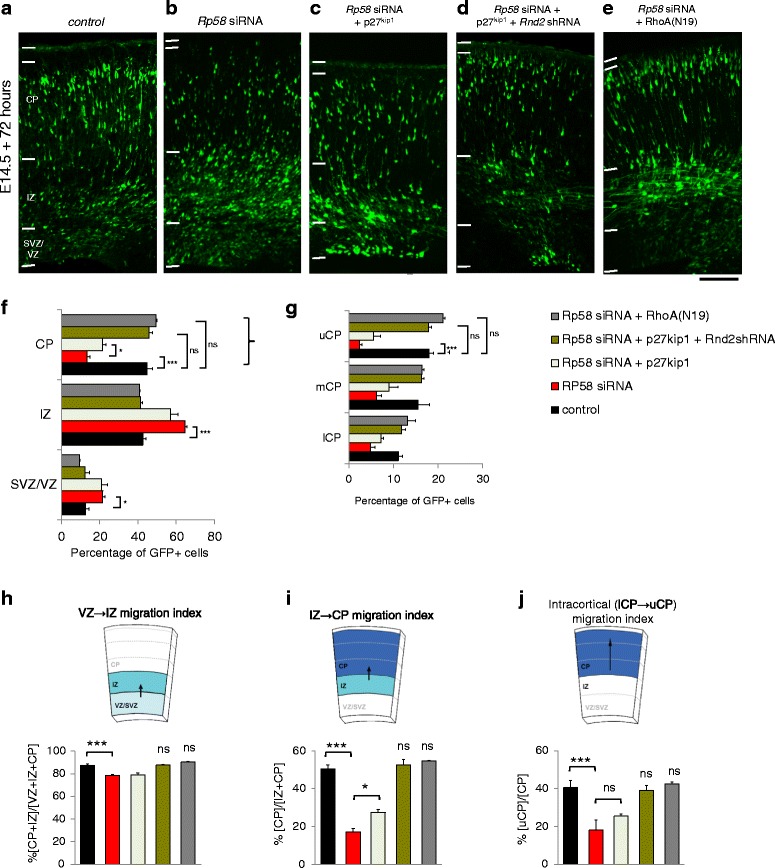
The defective migration of Rp58-deficient cells can be restored with forced expression of p27kip1 and concurrent suppression of Rnd2 by RNAi, and this phenotype is reminiscent of Rp58-deficient cells co-treated with a dominant-negative RhoA(N19) expression construct. a–e Representative images of GFP-labelled cells within the embryonic cortex following treatment with the conditions indicated. f There was a significant interaction between treatment condition and distribution of GFP-labelled cells (F8,36 = 106, p < 0.0001, Two-way ANOVA, >700 cells counted from 3 to 4 independent brains per condition). Knockdown of Rp58 with siRNAs leads to significant decrease in migration into the CP (a, b, f; p < 0.0001 Bonferroni posthoc t-test), but CP entry is only modestly restored by co-delivery with p27kip1 (b, c; f; p < 0.01 Bonferroni posthoc t-test). Forced expression of p27kip1 alone promotes radial migration into the CP (Additional file 6: Figure S5A–D). However, only co-delivery of p27kip1 and Rnd2 shRNA leads to a restoration of the migration of Rp58 siRNA-treated cells (b, d; b; p < 0.0001 Bonferroni posthoc t-test) to levels not significantly different to control CP profile. The radial migration of Rp58-deficient cells can also be restored by co-delivery of RhoA(N19) (b, e; f; p < 0.0001 Bonferroni posthoc t-test), and the CP profile is not significantly different to control. l Quantification of the proportion of GFP-expressing cells within each subcompartment of the embryonic (E17.5) cortex. g There was a significant interaction between treatment condition and distribution of GFP-expressing cells within the lower, medial and upper cortical plate (lCP, mCP and uCP, respectively) (F8,33 = 9.0, p < 0.0001, Two-way ANOVA, >700 cells counted from 3 to 4 independent brains per condition). h The VZ to IZ phase of migration calculated across conditions. i The IZ to CP phase of migration calculated across conditions. j The lower CP to upper CP phase of migration calculated across conditions. One-way ANOVA followed by Bonferroni’s posthoc t-test; *p < 0.05, **p < 0.01, ***p < 0.001 for (h) to (j). Scale bar represents 100 μm
