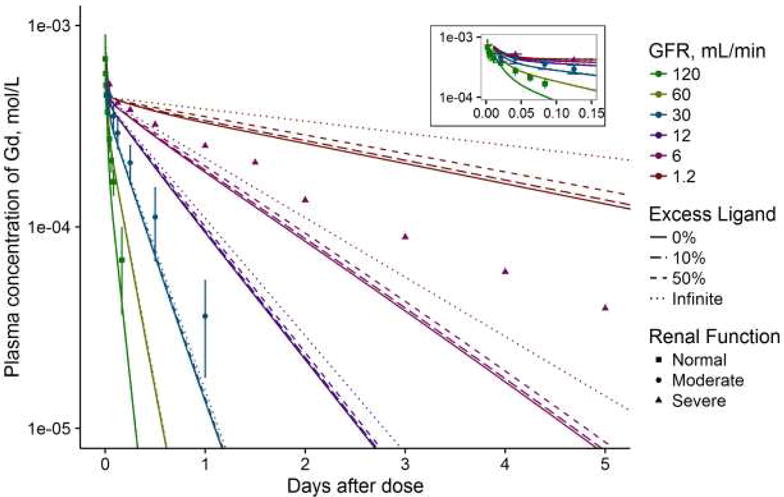
Figure 2.

The plasma concentration-time profile of GBCAs as modeled by the simulation. Patient data from clinical trials are plotted as points with different shapes, and error bars represent the standard deviations if they were reported. Points are colored to match the approximate matching renal function in the simulation; the normal renal function data were extracted from (43) with patients whose creatinine clearances (CrCl) were reported as normal (with minimum cited as 62 mL/min), the moderate renal function data were from (44) in patients who had an average CrCl of 39 mL/min (SD 8, range 25–50) and the severe renal function data were from (45) in patients with CrCl in the range of 0.6–13.5 mL/min. The line for “infinite” excess ligand is equivalent to the model without reversible chelation (i.e., if Gd could not dissociate). The inset presents the concentration-time curve for the first ~3 hours to demonstrate early model fit.
