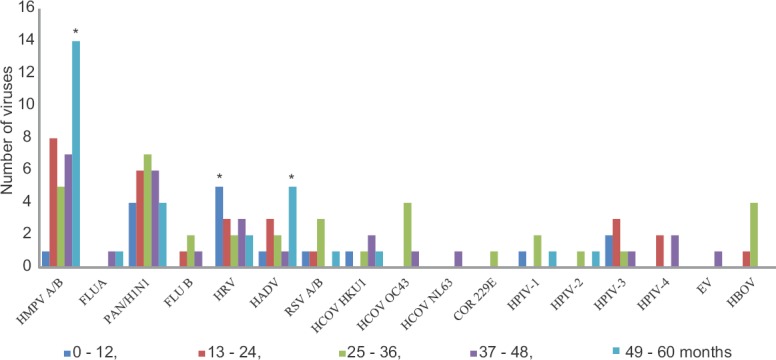
Fig. 1.

Graph showing the distribution of different respiratory viruses among children of different age groups (in months). *P < 0.05 (χ2 test, comparison among the different age groups). HMPV A/B, human metapneumovirus A/B; FLUA, influenza A; PAN/H1N1, Pandemic H1N1; FLUB, influenza B; HRV, human rhinovirus; HADV, human adenovirus; RSV A/B, respiratory syncytial virus A/B; HCOV HKU1, human coronavirus HKU1; HCOV OC43, human coronavirus OC43; HCOV NL63, human coronavirus NL63; COR 229E, human coronavirus COR 229E; HPIV-1, human parainfluenza virus 1; HPIV-2, human parainfluenza virus 2; HPIV-3, human parainfluenza virus 3; HPIV-4, human parainfluenza virus 4; EV, enterovirus; HBOV, human bocavirus.
