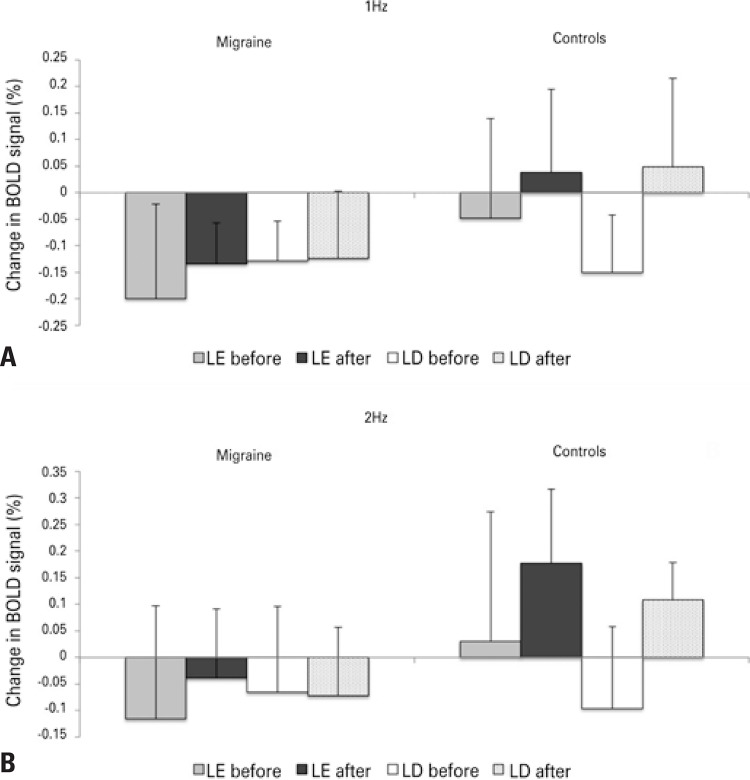
Figure 3. Variation in BOLD signal (%, contrast between finger-tapping, and rest) in patients with migraine (left) and controls (right) before and after light exposure and light deprivation, during finger tapping at 1Hz (A) and 2Hz (B). Mean percentage is shown by each bar. Error bar = standard deviation of the mean. Measurements were made in the local maxima of the region encompassing the superior border of the calcarine sulcus (V1, BA 17) and extrastriate cortex (V2, BA 18). x=0 y=-90 z=24.
LD: light deprivation; LE: to light exposure.

