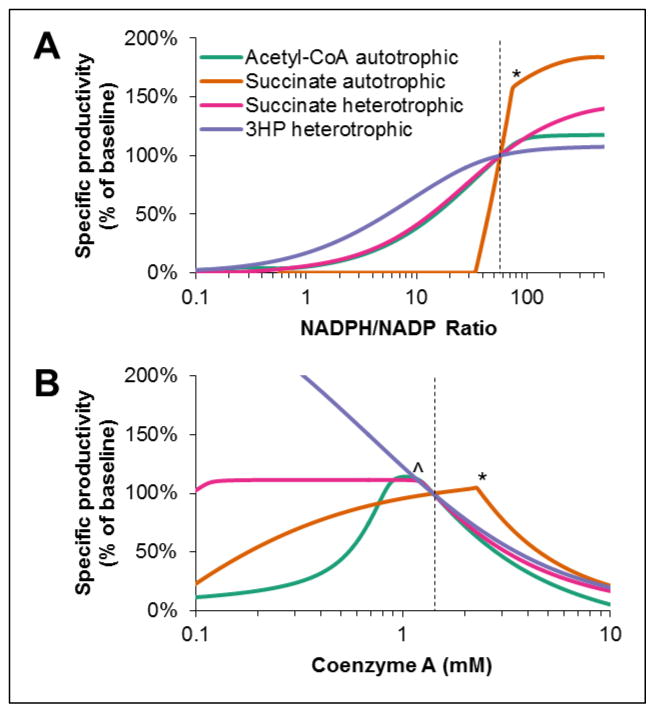
Figure 12. Effect of (A) NADPH and (B) coenzyme A concentrations on specific carbon fixation rate for metabolic engineering applications of 3HP/4HB cycle at optimum enzyme ratios predicted by model.
Dotted lines indicate the baseline NADPH and CoA concentrations at which enzymes ratios were optimized. *Sharp corners in curves for autotrophic succinate pathway represent points above which buildup of pathway intermediates prevents reaching steady-state. ^Sharp corner in heterotrophic succinate pathway represents the point below which buildup of pathway intermediates prevents reaching steady-state.

