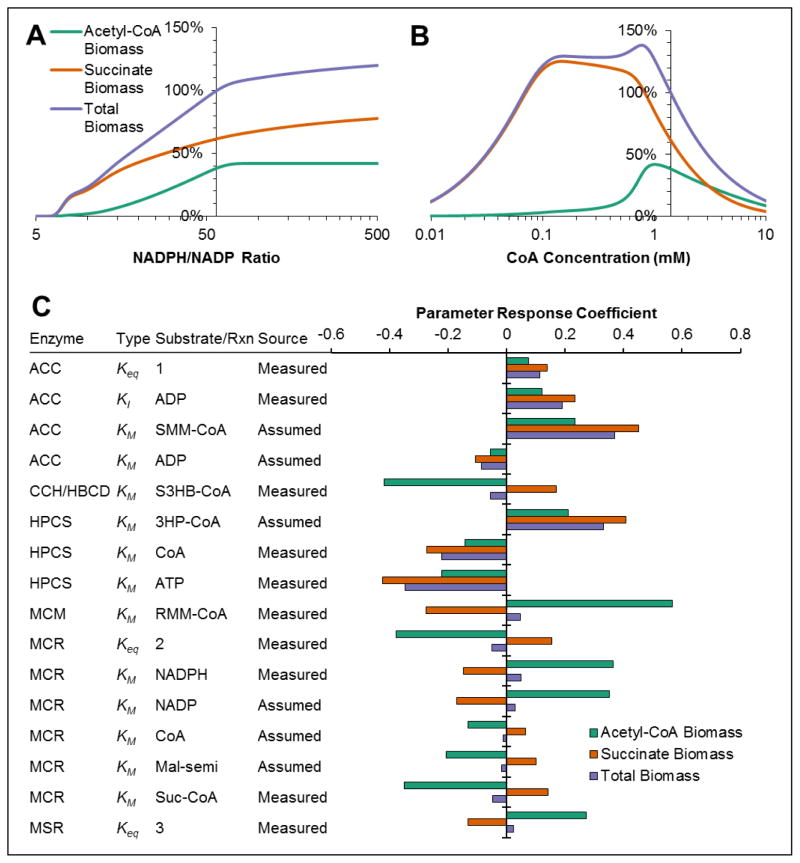
Figure 7. Effect of cofactor concentrations and parameters on 3HP/4HB cycle.
(A) Effect of NADPH concentration on biomass production rates, relative to the biomass production rate predicted after optimization. The y-intercept represents the concentration used for optimization. (B) Effect of CoA concentration on biomass production rates. (C) Parameter response coefficients for biomass production rates. Only parameter response coefficients >0.01 are shown.

