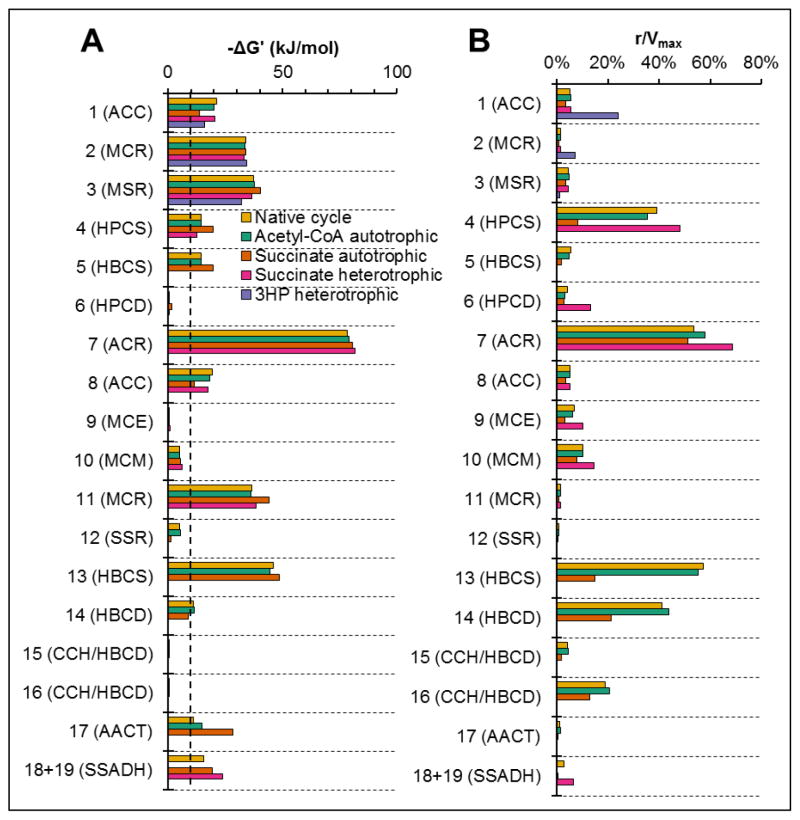
Figure 8. Thermodynamic landscape and kinetic utilization of 3HP/4HB cycle enzymes.
(A) −ΔG’, the Gibbs energy of reaction at steady-state metabolite concentrations and pH 5.4, represents the thermodynamic driving force of each reaction. The dotted line represents a driving force of 10 kJ/mol, above which the forward reaction accounts for >99% of the total enzyme reaction rate. (B) The ratio of actual reaction rate to maximum reaction rate for the enzyme (r/Vmax), representing the kinetic utilization of each enzyme.

