
Fig. 1.
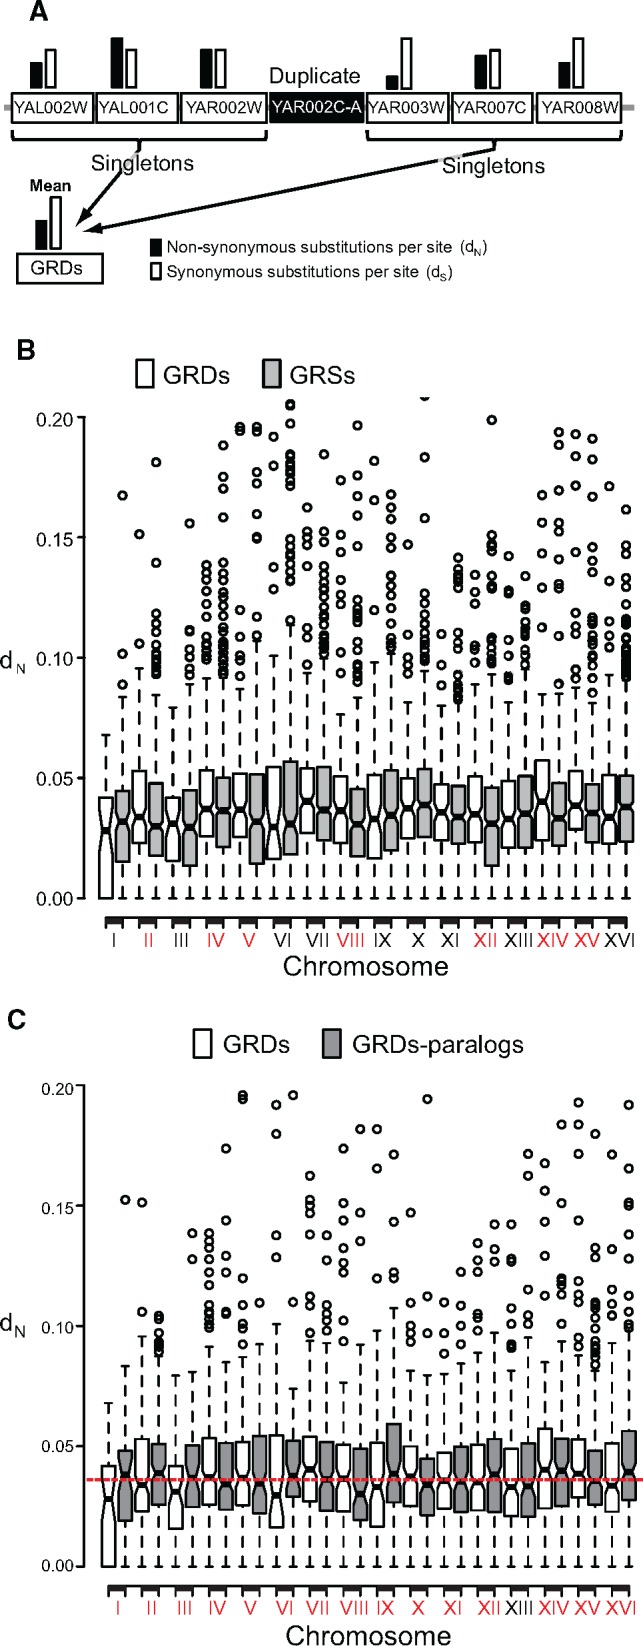
—Duplicated genes persist in genome evolutionary hotspots. (a) We estimated the mean nonsynonymous nucleotide substitutions per nonsynonymous site (dN: black column) and the synonymous substitutions per synonymous site (dS; white column), for the three singleton genes (Locus tag genes in the white rectangles) immediately flanking a duplicated gene (black rectangle) at either side. (b) The mean dN for each region containing a duplicate (GRDs) within each chromosome was calculated and compared to that of genome regions containing only singletons (GRSs). We identified seven chromosomes in which GRDs exhibited significantly higher dN than GRSs (red-labeled roman numbers in x axis). (c) For each of the duplicates contained in each GRD of each chromosome, we searched for its paralogue elsewhere in the genome. Then we compared the dN of both these groups and found that when one GRD of a chromosome exhibited a mean dN below the mean dN for GRSs (white boxes), their paralogs exhibited the inverse pattern (gray boxes), and vice versa. Red-labeled chromosomal numbers in the x axis indicate those for which evidence exist that at least one of the paralogs is in a GRD with high dN.