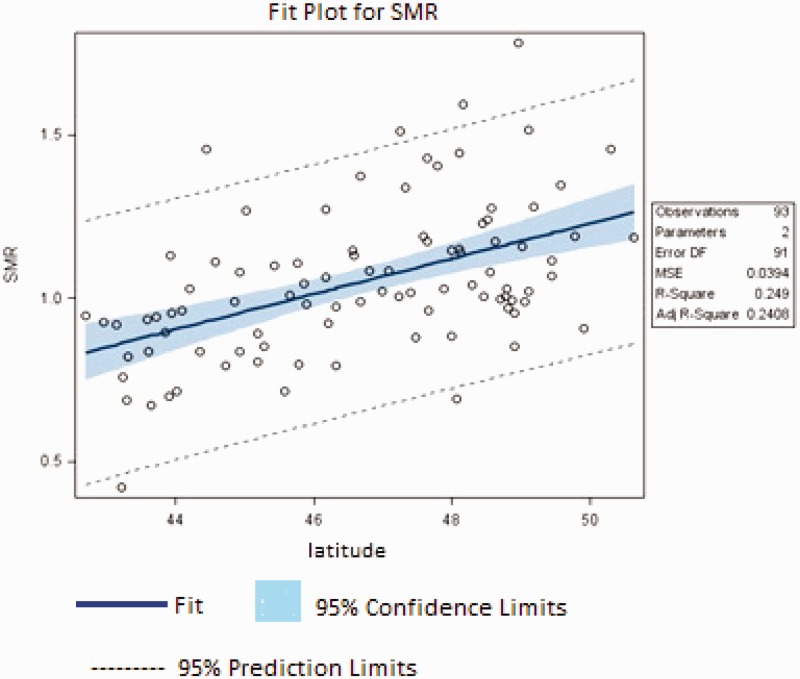
Figure 4.
Fit plot showing the model fit and summarising some of the statistics, for the simple linear regression model assessing the association of multiple sclerosis standardised prevalence ratio (SMR) with latitude (degrees north, based on prefecture cities), for each department of France (islands and overseas departments excluded).
Source: Health insurance fund for independent workers – whole of France.

