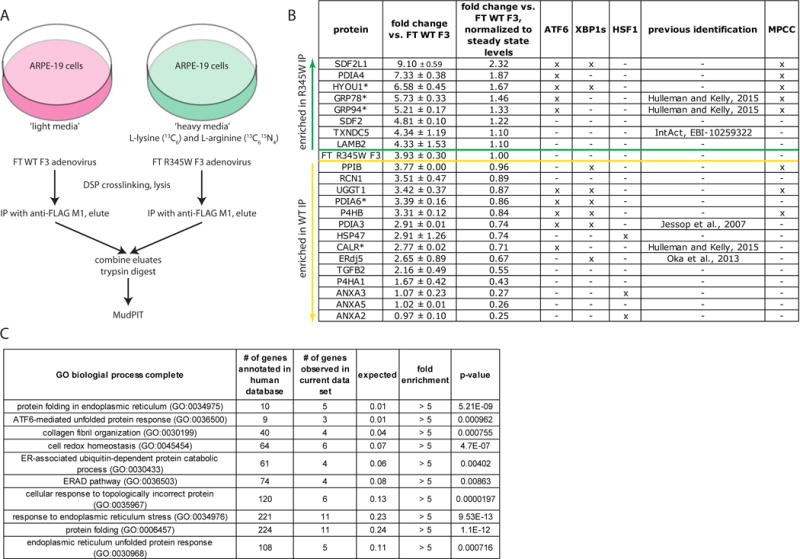
Fig. 1.

Schematic of the SILAC/MudPIT approach used to identify F3 interacting partners. (A) ARPE-19 cells were labeled with either ‘heavy’ or ‘light’ isotopes. Subsequently, the ‘light’ isotope cell line was infected with either FLAG-tagged (FT) WT F3, while the ‘heavy’ isotope cell line was infected with FT R345W F3 at an identical multiplicity of infection. Proteins which bound to FT F3 were eluted, combined, and trypsinized for quantitative mass spectrometry analysis by MudPIT. (B) List of identified F3 binding partners. An ‘x’ under ATF6, XBP1s, or HSF1 indicates that the expression of these proteins is regulated by one or more of the indicated transcription factors (Ryno et al., 2014; Shoulders et al., 2013). An ‘x’ under the MPCC column Indicates that the protein has been found in the “multi-protein chaperone complex” (MPCC) (Meunier et al., 2002). Proteins above the green line were found enriched in the R345W F3 interactome, while those below the yellow line were enriched in the WT F3 interactome. Proteins with an asterisk were among the top five enriched proteins based on spectral count. Data presented originate from two independent experiments, false discovery rate < 1%, minimum of two peptides per protein. (C) Gene ontology (GO) enrichment analysis of biological pathways of identified F3 binding partners.
