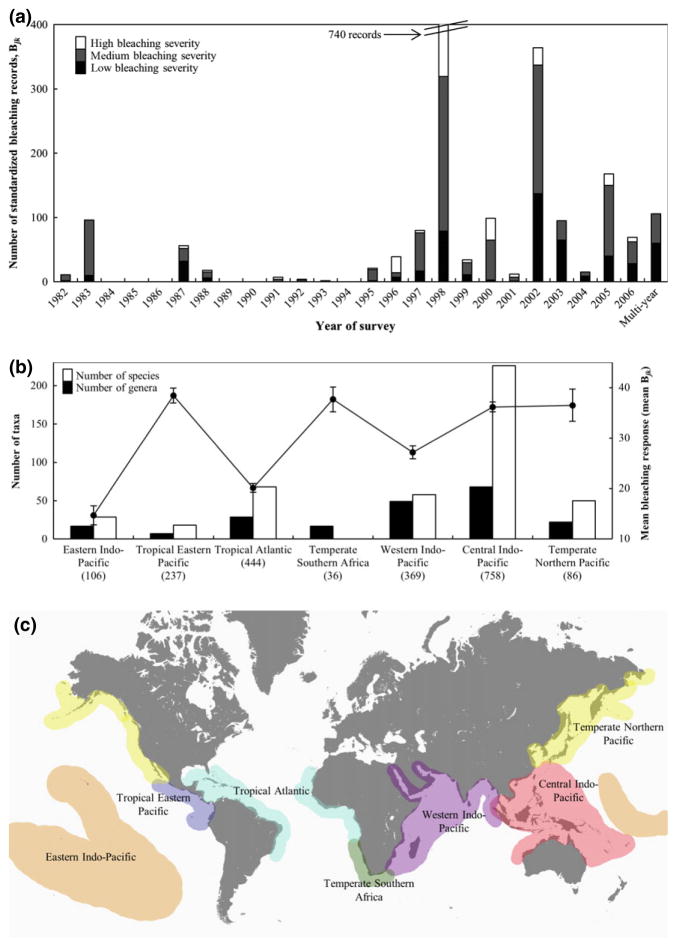
Fig. 2.
Years, locations, and responses of the 2036 standardized bleaching and mortality records (Bjk) used in this study. Number of records per year categorized as high (≥75th percentile; open bars), medium (grey bars), and low (≤25th percentile; black bars) bleaching severity (a). Number of taxa (genera solid and species open bars) and mean (and standard error; line with error bars) response (b) per biogeographic realm after Spalding et al. (2007) (c). Parenthetical values are the total number of records.

