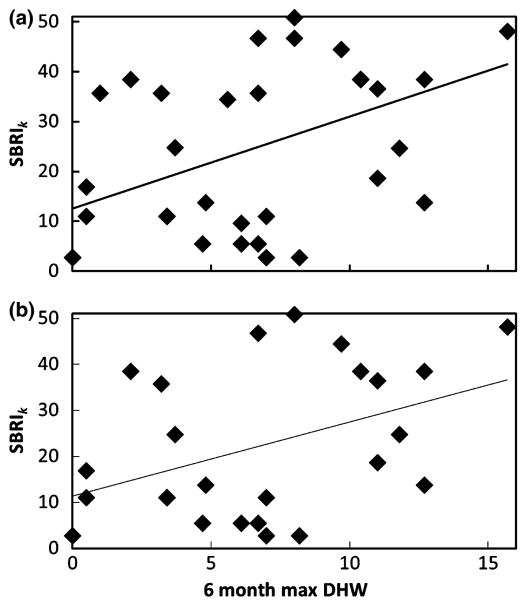
Fig. 4.
Regressions of site-specific BRI (SBRIk, Eqn 11) on 6 month–max degree heating weeks (DHW) for Caribbean sites during 1998–2006. Regressions shown using sites with at least three (35 sites; r2 = 0.21, P = 0.006) (a) or five (25 sites; r2 = 0.17, P = 0.038) (b) taxa per site, which contain a total of 39 or 38 unique taxa and 240 or 209 unique records, respectively.

