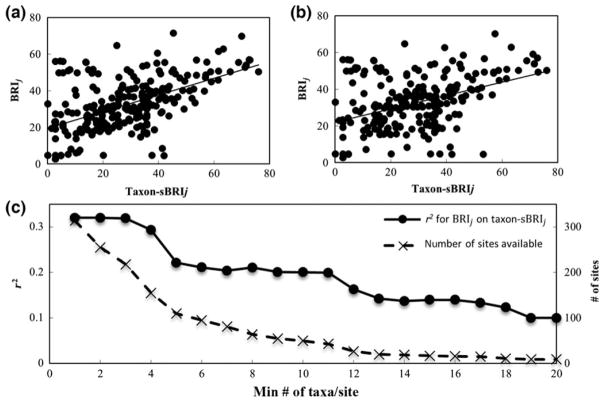
Fig. 5.
Relationship between the bleaching response of taxa (taxon-BRI or BRIj) and their communities (taxon-dependent site-BRI or taxon-sBRIj, Eqn 12) and its dependence on sample sizes. Regressions of BRIj on taxon-sBRIj for all (314) sites (r2 = 0.33, P < 0.001) (a) and for sites (43) with ≥10 taxa (r2 = 0.20, P < 0.001) (b). As the minimum number of taxa per site increases, r2 for BRIj on taxon-sBRIj regressions decrease (solid line), as well as the number of sites available (containing the minimum number of taxa) for analysis (dashed line).

