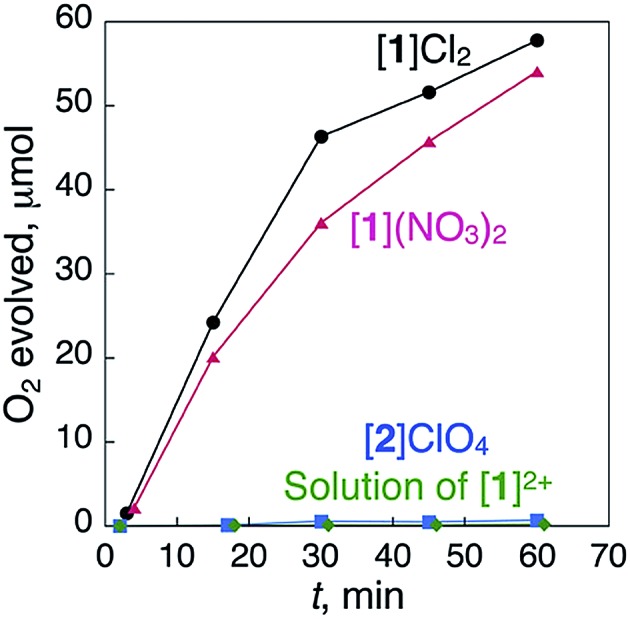
Fig. 2. Time-dependent profiles of the evolution of O2 during treatment with a catalytic amount of [1]Cl2 (5.0 mg), [1](NO3)2 (4.9 mg), [2]ClO4 (5.0 mg) and a homogeneous saturated solution of [1]Cl2 in H2O (0.83 mL) with 5% aqueous H2O2 (1.00 mL total) at 298 K.

