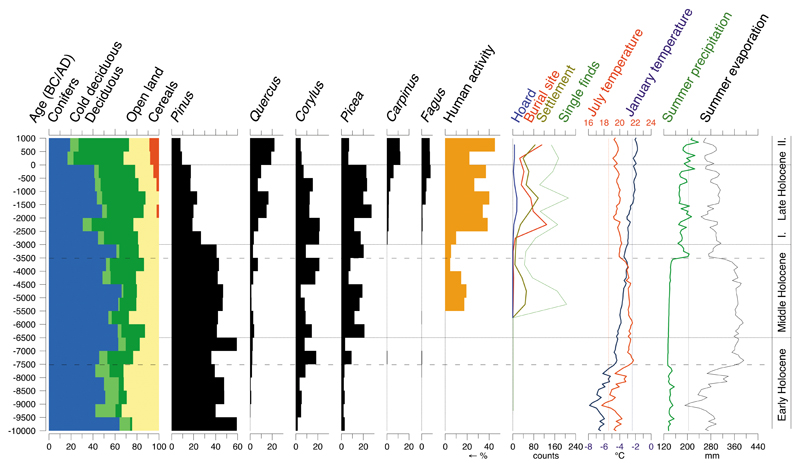
Fig. 4.
Diagram showing the general human activity model (parish occupancy likelihood) and differentiated human activity models in the study area, the results of the Macrophysical Climate Model (mean January temperature, mean July temperature, mean summer precipitation and mean summer evaporation) and major REVEALS-based vegetation components. Taxa are grouped as indicated in Fig. 3. Dotted horizontal lines separate major vegetation zones as in Fig. 3, dashed horizontal lines demarcate main climatic zones.

