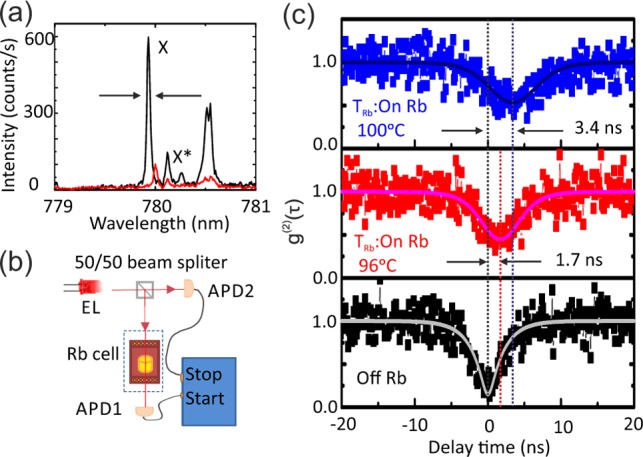
Figure 3.

(a) EL spectra of a second QD, acquired with a double spectrometer equipped with two 1200 l/mm gratings (spectral resolution ∼30 μeV). The two spectra correspond to two orthogonal polarization directions. Only the bright line marked by arrows (with a line width of 58 μeV) is used in the following measurement. (b) HBT setup used to extract the second-order correlation function, g(2)(τ), of the EL emitted by a single QD embedded in the Q-LED. A 75 mm long 87Rb vapor cell is inserted in one of the arms of the setup. (c) Black: g(2)(τ) measurement of the EL emission when the photon energy is tuned off resonance with respect to the 87Rb D2 transitions. Red and blue: g(2)(τ) values when the photon energy is tuned on resonance with the 87Rb D2 lines and the Rb cell temperature is 96 (red), and 100 °C (blue). The corresponding minimum values of g(2)(τ), reached at a TRb-dependent delay time τc(TRb) are 0.15, 0.44, and 0.53 for the data displayed in of the black, red, and blue, respectively. The gradual increase of τc and of g(2)(τc) with increasing TRb comes from the dispersion of the atomic optical medium. This leads to slow light and, due to the finite line width of our photon source, to time-jitter and consequent broadening of the g(2)(τ) curve.
