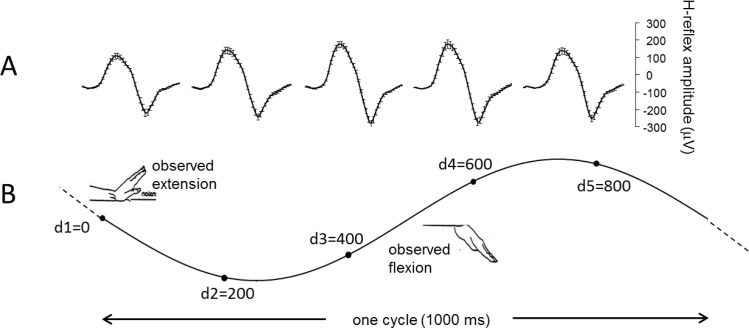
Fig 1. Data acquisition and experimental protocol.
(A) Average traces (μV ±SEM) of 25 H-reflexes recorded from a single subject, in a single trial of movement observation in the explicit condition. (B) Average sinusoidal time course of 25 flexion-extension hand movements. Black dots on the sinewave indicate the 5 different delays during the hand flexion-extension cycle in which reflexes were recorded (d1 = 0, d2 = 200, d3 = 400, d4 = 600, d5 = 800 ms) corresponding to 5 different hand angular positions, dividing the 1Hz oscillation cycle in five equal parts. Note the motor resonant response, i.e. the modulation of the reflex amplitude matches the cyclic time course of the observed movement, with smaller reflexes recorded during observation of the extension phase (e.g. d1 and d5) and larger ones during the observation of the flexion phase (e.g. d3 and d4).

