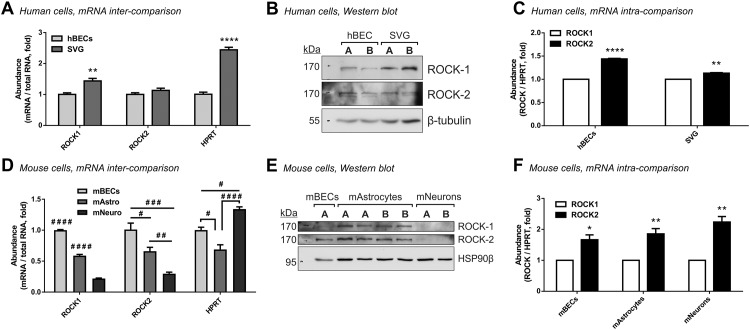
Fig 1. ROCK-2 is the primary isoform expressed in cells of the neurovascular unit.
Real-time RT-PCR (A; n = 4 for each cell type) and western blot analysis (B) showing higher steady-state levels of ROCK-1 and similar levels of ROCK-2 (per equal quantities of total RNA and proteins) in unstimulated human SVG astrocytes compared to human brain microvascular endothelial cells (hBECs). (C) Comparative qPCR analysis (by ΔΔCt, normalising to HPRT) in hBECs and SVGs (n = 4 each) demonstrating that ROCK-2 is the principal ROCK transcript expressed in each human cell type. (D) Real-time RT-PCR in equal quantities of RNA from unstimulated primary mouse neurons (mNeuro; n = 4) and primary mouse astrocytes (mAstro; n = 4) relative to primary mouse brain endothelial cells (mBECs; n = 3). mBECs are enriched in ROCK-1 and ROCK-2 transcripts while mouse neurons contains the least. (E) Western blot analysis of ROCK-1 and ROCK-2 protein levels in unstimulated mouse BECs, astrocytes and neurons. (F) Comparative qPCR analysis of ROCK-1 versus ROCK-2 mRNA relative to HPRT within primary mouse BECs (n = 3), astrocytes (n = 4) and neurons (n = 4). The ROCK-2 isoform is dominant also within each of the mouse brain cell types. In all panels bars represent mean±SEM. *P<0.05, **P<0.01, ****P<0.0001 compared to the respective reference column (on the left) by two-tailed unpaired (A) or paired (B, D) t-tests. # P<0.05, ## P<0.01, ### P<0.001, #### P<0.0001 (compared to all other groups if unspecified) by one-way ANOVA with Tukey’s post hoc analysis. In panels (B) and (E) the letters A and B represent independent cultures.

