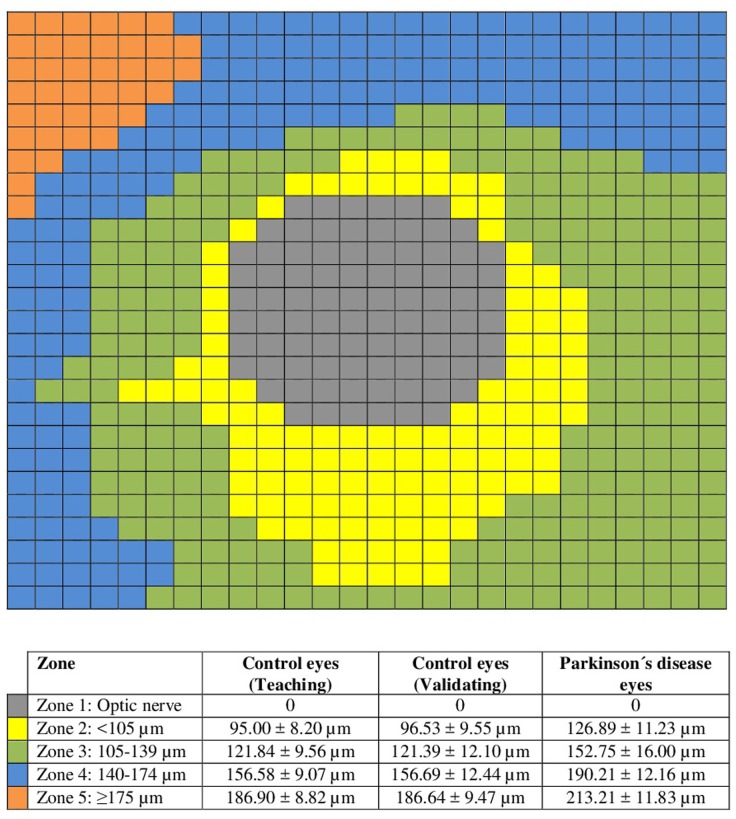
Fig 2. Schematic representation of the 5 zones defined in the 26×26 cube-grid using the peripapillary choroidal thickness measurements in the teaching control population: Zone 1, corresponding with optic nerve head in grey; zone 2 corresponds with mean peripapillary choroidal thickness (PPCT) <105 μm and is represented in yellow; zone 3 corresponds with mean PPCT ranging from 105 to 139 μm, and is represented in green; zone 4 corresponds with mean PPCT ranging from 140 to 174 μm, and is represented in blue; and zone 5 corresponds with mean PPCT ≥175 μm and is represented in orange.
Bottom table: Mean PPCT ± standard deviation of each zone for the three groups evaluated (teaching control group, validating control group, and Parkinson´s disease group).

