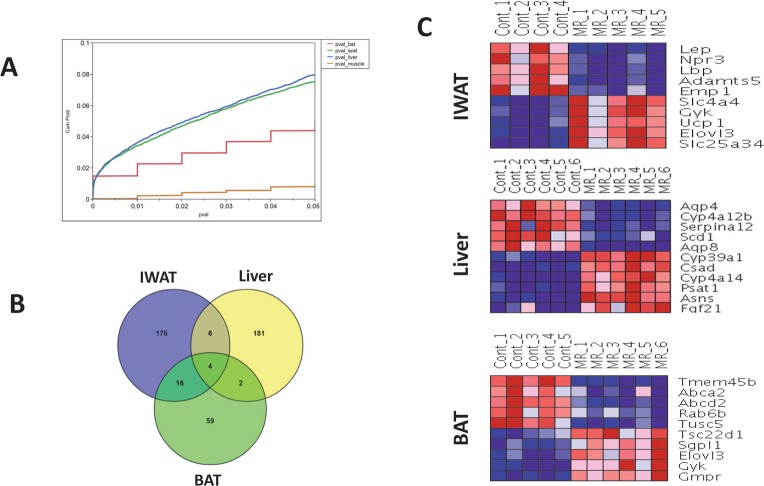
Fig 2. Overview of differential gene expression in tissues.
(A) Cumulative probability plot of differentially expressed genes in IWAT (green), liver (blue), BAT (red) and skeletal muscle (brown), depicting the fraction of all genes (y-axis) satisfying the various nominal p-value cutoffs (x-axis). Only genes with nominal p-value ≤0.05 are shown. (B) Overlap analysis of the differentially expressed genes, with adjusted p-value ≤0.05, in IWAT, liver and BAT (no genes identified at this threshold in skeletal muscle). (C) Heatmaps depicting expression patterns of top 10 differentially expressed genes (5 up-regulated and 5 down-regulated) across methionine-restricted and Control samples in IWAT, liver and BAT. Genes are selected based on the magnitude of fold-changes, and all genes have an adjusted p-value ≤0.05. Expression values are row-normalized for each gene with shades of blue indicating lower expression and red indicating higher expression.

