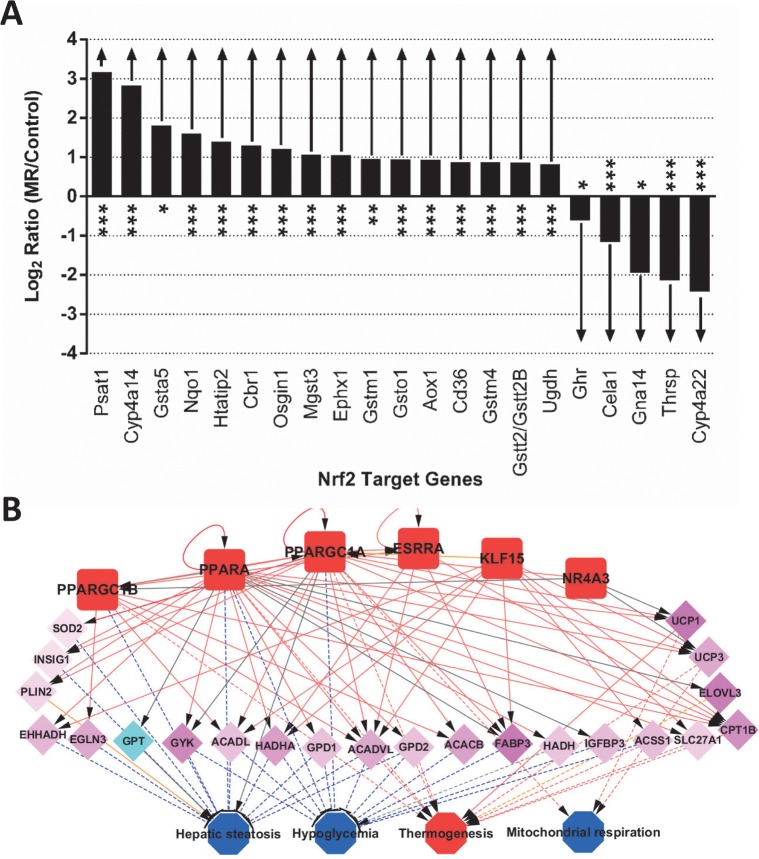
Fig 4. Prediction of upstream regulators’ involvement in the transcriptomic response.
(A) Response of NFE2L2 target genes in liver from MR-fed mice, compared to Control. The list of NFE2L2 target genes was obtained from the Ingenuity Knowledge Base and their fold-change (MR vs. Control, log2 scale) is plotted on the y-axis. Statistical significance of differential expression is indicated for each gene—*, p<0.05; **, p<0.005; ***, p<0.0005. (B) Predicted transcription factor (TF) network in MR-treated IWAT. Several transcription factors with predicted activation from IPA analysis are integrated into a network based on overlapping target genes, and the effect of these changes on downstream processes are also modeled. Interactions between TF:target genes and between genes: downstream processes are shown as solid or dashed lines, respectively. Genes (middle panel) are color coded based on their observed upregulation or downregulation in MR vs. Control samples. Upstream regulators and downstream processes are colored based on their activation or inhibition status (red and blue, respectively). Edges representing activating interactions are shown in red, inhibitory interactions in blue, unknown effects in gray, and findings inconsistent with literature in yellow.

