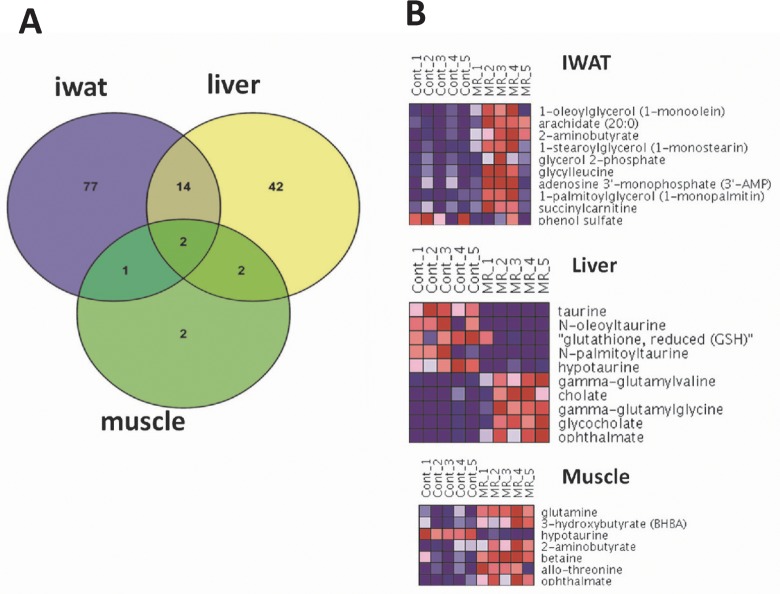
Fig 5. Overview of metabolite expression in tissues.
(A) Overlap analysis of the differentially expressed metabolites, with adjusted p-value ≤0.05, in IWAT, liver and muscle. (B) Heatmaps depicting expression patterns of top differentially expressed metabolites across MR and Control samples in IWAT, liver and muscle. Metabolites are selected based on the magnitude of fold-changes, and all metabolites have an adjusted p-value ≤0.05 (for muscle, only 7 metabolites met the adjusted p-value criterion). Expression values are row-normalized for each metabolite with shades of blue indicating lower expression and red indicating higher expression.

