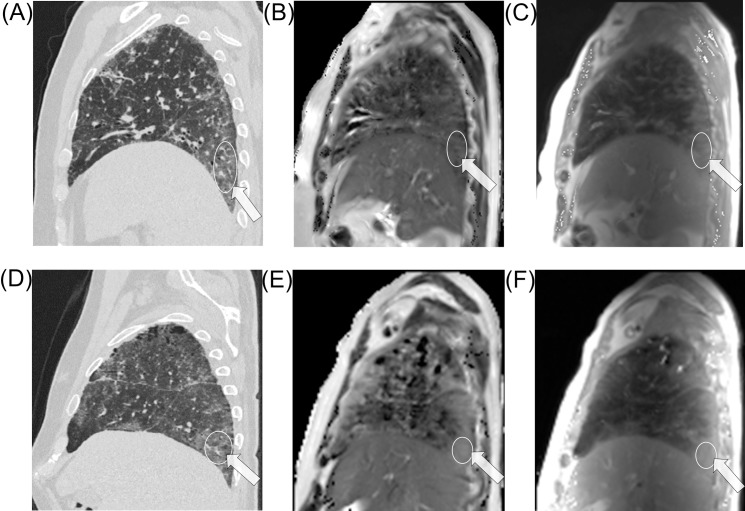
Fig 1.
A 59 year old male patient with stable NSIP: image A is the sagittal reformat CT reference image, with the arrow indicating the region of interest, followed by the T2 map, image B and PD intensity map, image C. Below is the case of a 65 year old male patient with NSIP and suspected inflammatory activity and his corresponding images, D to F. Both cases show similar CT morphology and inhomogeneous T2 relaxation and PD of the lung; there is higher T2 relaxation and PD intensity on both type of maps in the active disease case. Exemplary ROI placement in relevant pathological areas is demonstrated.

