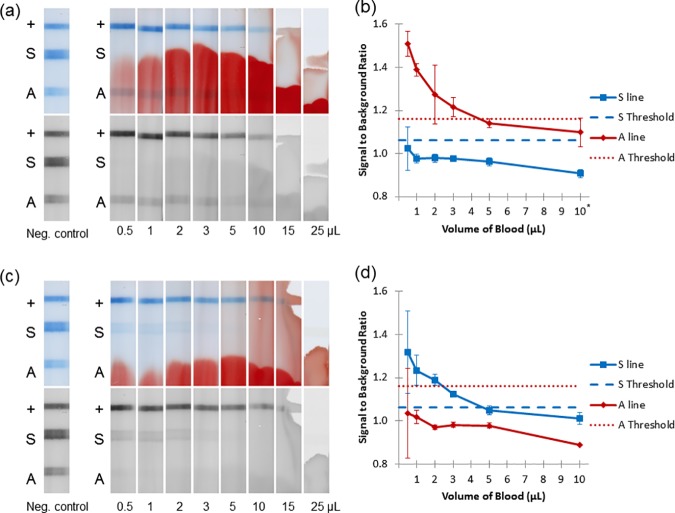
Fig 2. Determining the range of acceptable blood volume.
(a) Representative strips run with varying amounts of normal blood, including a negative control with no blood. Top image shows full-color scan; bottom image shows red channel of the same image. (b) Signal-to-background ratio of strips in part a (normal blood) and the A threshold set by previous experiment. Error bars represent ±1 SD of three strips. *10 μL represents the average of only 2 strips. (c) Representative strips run with varying amounts of SCA blood, including a negative control with no blood. (d) Signal-to-background ratio of strips in part c (SCA blood) and the S threshold set by previous experiment.

