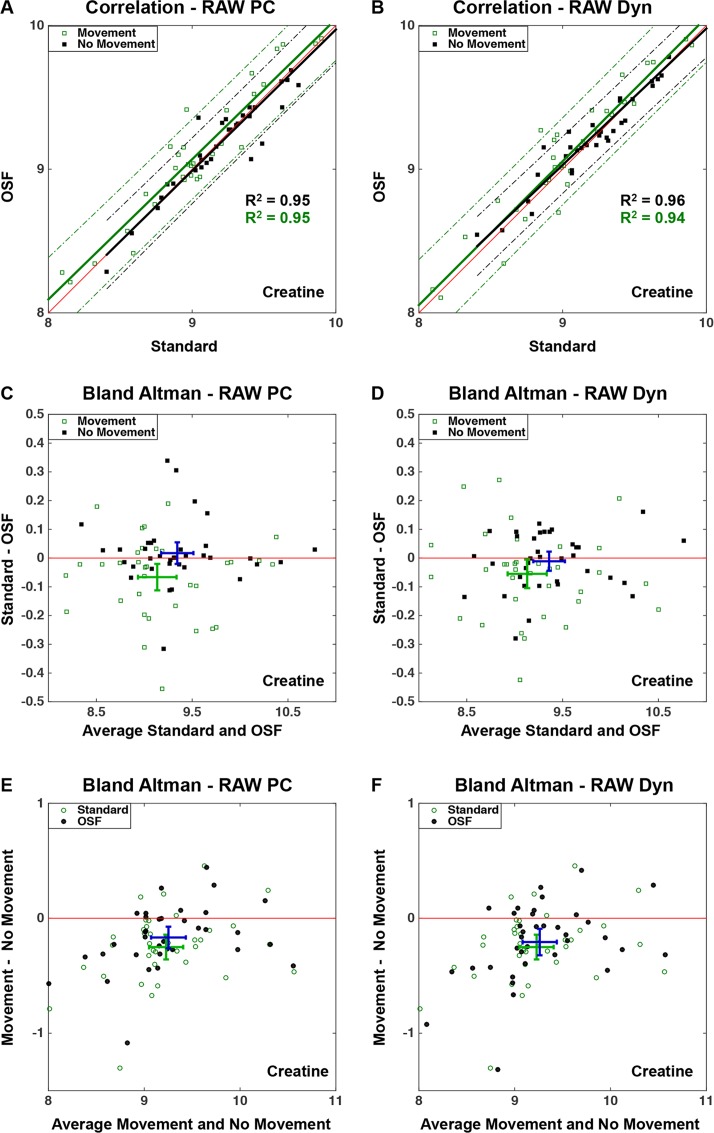
Fig 6.
Correlation plots (A, B) and Bland Altman plots (C, D, E, F) comparing creatine concentrations computed using the three post-processing techniques described in Fig 3 applied solely to the OFF-dynamics, and comparing acquisitions with and without intentional movements. The correlation plots (A, B) show the linear relationship between the two OSF techniques and the standard technique, each having a linear fit with a 95% confidence interval plotted for the creatine concentrations with and without intentional movements. The Bland Altman plots (C, D) show the difference between the standard technique and OSF plotted against the average creatine concentration obtained from these two techniques, and (E, F) illustrates the differences in creatine concentrations between measurements with and without intentional movements. The mean difference and mean average are illustrated by the locations of the intersecting intervals for estimates without movements (C, D) and OSF (E, F) shown in dark blue, and with movements (C, D) and Standard technique (E, F) shown in green. The intersecting intervals illustrate the 95% confidence intervals of the mean difference and mean average.

