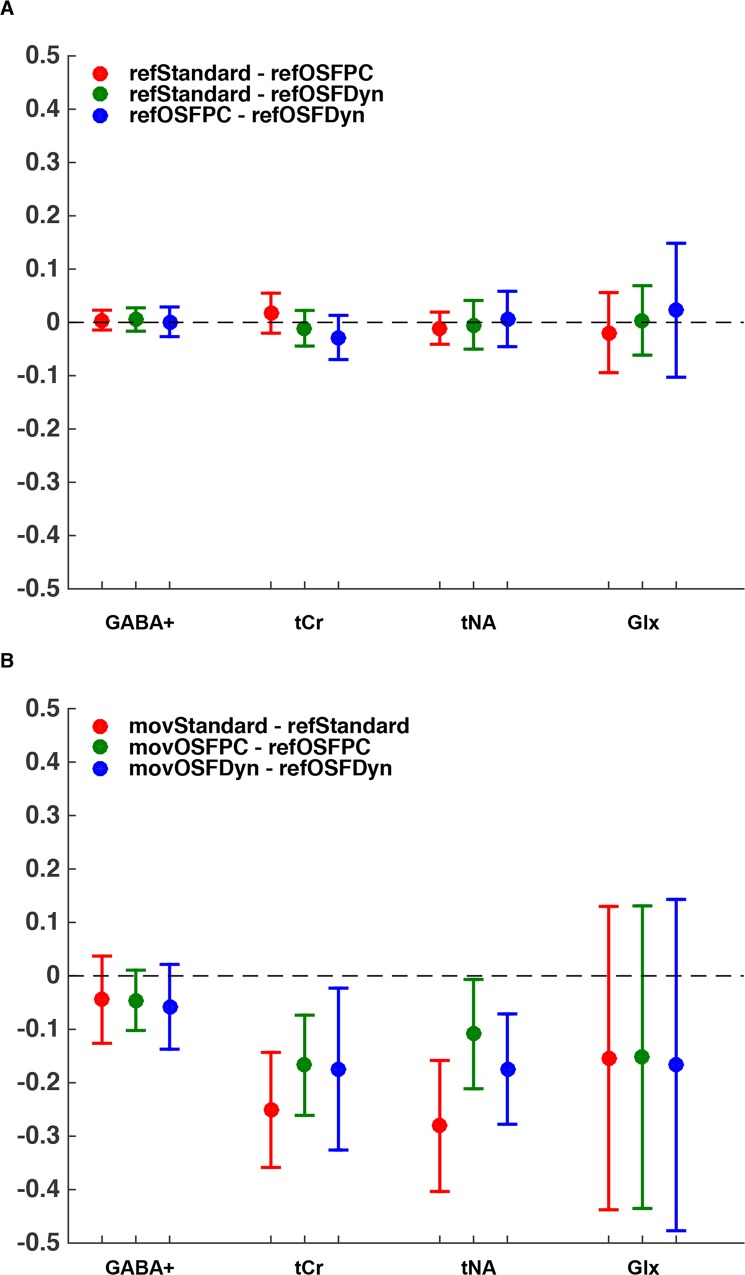
Fig 8. The confidence intervals computed from the paired t-tests performed for the GABA+, tCr, tNA and Glx concentrations.
(A) Paired t-tests performed between the three different post-processing techniques applied only to the reference measurements. The three paired t-tests (refStandard–refOSFPC, red), (refStandard–refOSFDyn, green), and (refOSFPC–refOSFDyn, blue) were performed. (B) Paired t-tests performed between the measurements with movements and the reference measurements analyzed with the same post-processing method. The three paired t-tests (movStandard–refStandard, red), (movOSFPC–refOSFPC, green), and (movOSFDyn–refOSFDyn, blue) were performed.

