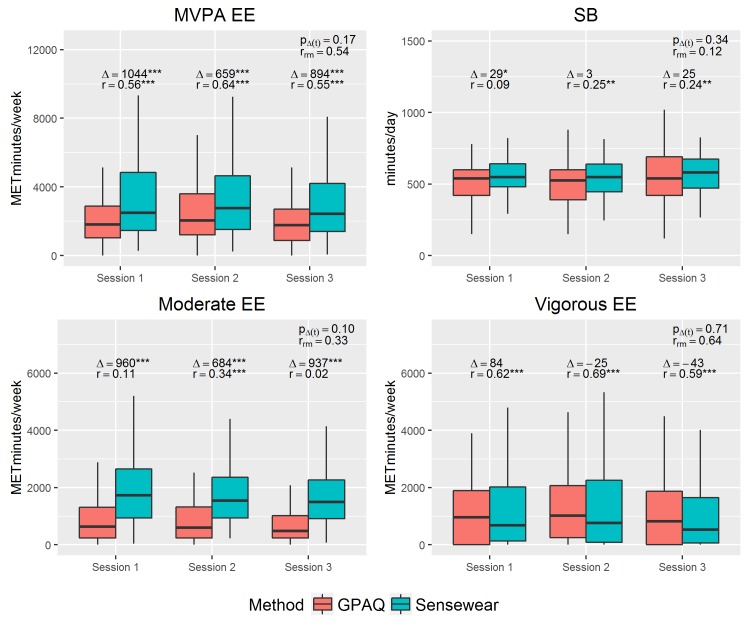
Fig 1. Boxplots of MVPA energy expenditure (EE), SB, moderate EE and vigorous EE per method and session.
For each session, the difference Δ and Spearman correlation coefficient r is specified. Δ was calculated as the mean difference between both methods and was tested for significance using the Wilcoxon signed rank sum test. rrm is the overall Spearman correlation adjusted for repeated measures (rm) [33]; pΔ(t) = the p-value of the effect of session in the Δ(t) model which indicates if the difference between GPAQ and SenseWear measurements changes per repeated measurement. Statistical significance is expressed as *p<0.05, **p<0.01, and *** p<0.001.

