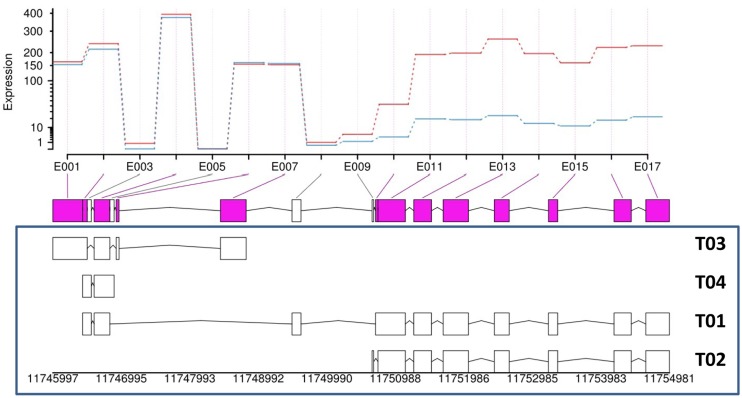
Fig 2. Differential usage of exons in stc1 in response to JA treatment.
The lower panel is a schematic representation of the four isoforms (T01~T04) of stc1. The middle panel is a collapsed view of all exons from the four isoforms. The upper panel represents mean expression levels of each exon in control (blue lines) and JA-treated (red lines) samples.

